Real estate market report for the greater Phoenix, AZ metro area.
Or, if you prefer to search by City or <Zip Code>, please select one of those options
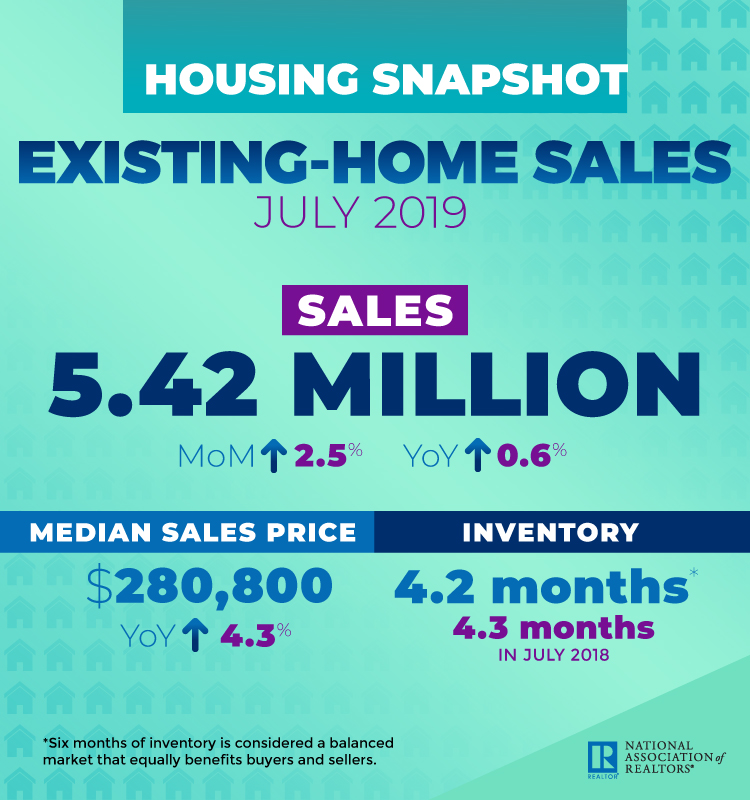
National Real Estate Statistics
The National Association of Realtors® reported that existing home sales strengthened in July 2019 to 5.42 million in sales, up 0.6% from a year ago, and the median single-family home list price in July 2019 was $280,800, up 4.3% from July 2018 which was $269,300. Nationwide the total unsold inventory at the end of July decreased to 4.2 months of supply. National average days on market increased to 29 days, from 27 days in July 2018. The percentage of total sales for first-time homebuyers fell slightly to 32%, and the percentage of individual investor purchases, which are typically all-cash sales, increased slightly to 11%. Distressed (foreclosure or short sale) sales percentage went down slightly to 2%.
John Smaby, NAR President, said “ Present rates have opened the market for a number of potential buyers who couldn’t afford a home just a year ago”. He also said “ Additionally, NAR has been working with the FHA for years to establish new condominium loan policies. Our hard work has paid off, and this change will begin benefiting buyers, sellers and our members as soon as this fall. ”
August 2019 Maricopa County Statistics
August 2019 Pinal County Statistics
Phoenix Metro Area Statistics
In the greater Phoenix metro area serviced by the Arizona Regional Multiple Listing System, ARMLS, the July 2019 median list price average was $280,000. The median sales price is expected to remain the same for August.
Days on market in the greater Phoenix area in July went down to 63, which is slightly up from July 2018 at 60.
Inventory in the Phoenix metro area is down slightly from 2.12 in June 2019 to 1.96 month’s supply reported for July 2019. Low inventory continues to drive price appreciation in most markets within the Phoenix metro area.
| Month Year | Median Price | Average Price | Active | Under Contract | Sold | Months Supply | DOM |
| July-19 | 280000 | 341600 | 18007 | 10855 | 9192 | 1.96 | 63 |
| June-19 | 279900 | 350600 | 19778 | 10972 | 9313 | 2.12 | 65 |
| May-19 | 278000 | 389200 | 21386 | 12289 | 10341 | 2.07 | 65 |
| Apr-19 | 270000 | 339900 | 23084 | 12536 | 9493 | 2.43 | 69 |
| Mar-19 | 267,000 | 338,000 | 23164 | 11995 | 8344 | 2.78 | 72 |
| Feb-19 | $264,000 | $326,800 | 23271 | 10843 | 6409 | 3.63 | 73 |
| Jan-19 | $262,100 | $326,100 | 22903 | 9247 | 5357 | 4.28 | 72 |
| Dec-18 | $262,000 | $326,000 | 20694 | 6441 | 6403 | 3.23 | 68 |
| Nov-18 | $262,000 | $326,500 | 21477 | 8030 | 6515 | 3.3 | 64 |
| Oct-18 | $262,000 | $324,300 | 21742 | 8307 | 7182 | 3.03 | 61 |
| Sep-18 | $260,000 | $317,500 | 20200 | 8591 | 6897 | 2.93 | 63 |
| Aug-18 | $263,000 | $322,800 | 19822 | 9193 | 8036 | 2.47 | 62 |
| Jul-18 | $265,000 | $320,500 | 19755 | 9135 | 8380 | 2.36 | 60 |
| Jun-18 | $268,000 | $333,600 | 20357 | 10618 | 9079 | 2.24 | 62 |
| May-18 | $265,000 | $331,000 | 20676 | 11630 | 9913 | 2.09 | 63 |
| Apr-18 | $ 254,000 | $ 322,000 | 21772 | 12309 | 8990 | 2.42 | 66 |
| Mar-18 | $254,000 | $316,400 | 21703 | 12319 | 9402 | 2.31 | 72 |
| Feb-18 | $252,500 | $308,000 | 21771 | 12161 | 6911 | 3.18 | 76 |
| Jan-18 | $245,000 | $315,300 | 21664 | 10696 | 6082 | 3.56 | 77 |
Maricopa County Total Inventory vs New Inventory
- 12726,11845,10799,10203,9906,9837,10916,12325,13524,13334,13347,14249
- 6789,6266,6228,5949,5487,6226,6387,6632,5636,4268,7555,7160
Information is deemed to be reliable, but is not guaranteed. © 2024
Maricopa County Absorption Rate
The absorption rate is calculated by dividing the average number of sales per month by the total number of available homes. This shows the rate at which available homes are sold in a specific market during a given time period.
- 2.32,2.23,2.1,2.01,1.96,1.96,2.18,2.5,2.75,2.73,2.74,2.93
Information is deemed to be reliable, but is not guaranteed. © 2024
Have questions or need a market analysis for your current home? Contact us using the form below, or call 480-748-4079.
