Real estate market report for the greater Phoenix, AZ metro area.
Or, if you prefer to search by City or <Zip Code>, please select one of those options
National Real Estate Statistics
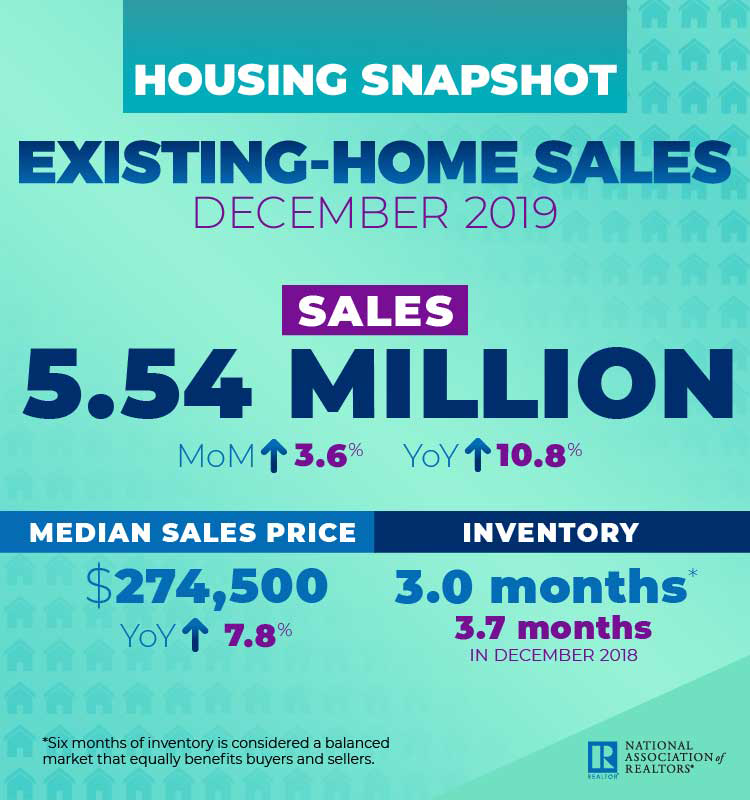
The National Association of Realtors® reported that existing home sales increased 3.6% in December 2019 to 5.54 million following a small decline in November. Despite variances regionally, the overall sales are up impressively 10.8% from a year ago (5.00 million in December 2018).
The median single-family home list price in December 2019 was $274,500, up 7.8% from December 2018 which was $254,700. The year over year price increase in December marks 94 months in a row of gains.
Nationwide the total unsold inventory at the end of December 2019 decreased to 3.0 months of supply (3.7 in November 2019, and 3.7 in December 2018). Housing inventory has dropped for 7 months in a row from the same time a year ago, which is negatively impacting home sales.
December’s national average days on market increased to 41 days, from 38 days in November, and lower than December 2018 at 46.
The percentage of total sales for first-time homebuyers decreased slightly to 31% in December 2019, and the percentage of individual investor purchases, which are typically all-cash sales, increased to 17%. Distressed (foreclosure or short sale) sales percentage remains at 2%.
Lawrence Yun, NAR’s chief economist, stated there are favorable conditions for buying continuing into 2020. “We saw the year come to a close with the economy churning out 2.3 million jobs, mortgage rates below 4% and housing starts ramp up to 1.6 million on an annual basis”. “If these factors are sustained in 2020, we will see a notable pickup in home sales in 2020.” said Yun.
NAR’s President, Vince Malta, broker at Malta & Co., Inc in California said “NAR is expecting 2020 to be a great year for housing. Our leadership team is hard at work to secure policies that will keep our housing market moving in the right direction, like promoting infrastructure reform, strengthening fair housing protections and ensuring mortgage capital remains available to responsible, mortgage-ready Americans”.
December 2019 Maricopa County Statistics
December 2019 Pinal County Statistics
Phoenix Metro Area Statistics
In the greater Phoenix metro area serviced by the Arizona Regional Multiple Listing System, ARMLS, the December 2019 median list price was $295,000. The median sales price for December 2019 was $289,900, unexpectedly higher than November 2019 not following seasonal trends.
Days on market in the greater Phoenix area in November 2019 increased to 61, which is lower than December 2018 at 68.
Months supply of inventory in the Phoenix metro area is also not following the season trend, decreasing 2.49 in November 2019 to 2.05 in December 2019. Low inventory continues to drive price appreciation in most markets within the Phoenix metro area.
| Month Year | Median Price | Average Price | Active | Under Contract | Sold | Months Supply | DOM |
| Dec-2019 | $289,900 | $359,600 | 12425 | 7922 | 7585 | 2.05 | 61 |
| Nov-2019 | $283,500 | $354,900 | 13675 | 9359 | 6974 | 2.49 | 58 |
| Oct-2019 | $285,000 | $345,100 | 14427 | 9950 | 7848 | 2.35 | 59 |
| Sept-19 | $280,000 | $333,700 | 13936 | 9694 | 7850 | 2.27 | 59 |
| Aug-19 | $280,000 | $338,700 | 13350 | 10493 | 8726 | 2.0 | 63 |
| July-19 | $280,000 | $341,600 | 18007 | 10855 | 9192 | 1.96 | 63 |
| June-19 | $279,900 | $350,600 | 19778 | 10972 | 9313 | 2.12 | 65 |
| May-19 | $278,000 | $389,200 | 21386 | 12289 | 10341 | 2.07 | 65 |
| Apr-19 | $270,000 | $339,900 | 23084 | 12536 | 9493 | 2.43 | 69 |
| Mar-19 | $267,000 | $338,000 | 23164 | 11995 | 8344 | 2.78 | 72 |
| Feb-19 | $264,000 | $326,800 | 23271 | 10843 | 6409 | 3.63 | 73 |
| Jan-19 | $262,100 | $326,100 | 22903 | 9247 | 5357 | 4.28 | 72 |
| Dec-18 | $262,000 | $326,000 | 20694 | 6441 | 6403 | 3.23 | 68 |
| Nov-18 | $262,000 | $326,500 | 21477 | 8030 | 6515 | 3.3 | 64 |
| Oct-18 | $262,000 | $324,300 | 21742 | 8307 | 7182 | 3.03 | 61 |
| Sep-18 | $260,000 | $317,500 | 20200 | 8591 | 6897 | 2.93 | 63 |
| Aug-18 | $263,000 | $322,800 | 19822 | 9193 | 8036 | 2.47 | 62 |
| Jul-18 | $265,000 | $320,500 | 19755 | 9135 | 8380 | 2.36 | 60 |
| Jun-18 | $268,000 | $333,600 | 20357 | 10618 | 9079 | 2.24 | 62 |
| May-18 | $265,000 | $331,000 | 20676 | 11630 | 9913 | 2.09 | 63 |
| Apr-18 | $ 254,000 | $ 322,000 | 21772 | 12309 | 8990 | 2.42 | 66 |
| Mar-18 | $254,000 | $316,400 | 21703 | 12319 | 9402 | 2.31 | 72 |
| Feb-18 | $252,500 | $308,000 | 21771 | 12161 | 6911 | 3.18 | 76 |
| Jan-18 | $245,000 | $315,300 | 21664 | 10696 | 6082 | 3.56 | 77 |
Maricopa County Total Inventory vs New Inventory
- 12726,11845,10799,10203,9906,9837,10916,12325,13524,13334,13347,14249
- 6789,6266,6228,5949,5487,6226,6387,6632,5636,4268,7555,7160
Information is deemed to be reliable, but is not guaranteed. © 2024
Maricopa County Absorption Rate
The absorption rate is calculated by dividing the average number of sales per month by the total number of available homes. This shows the rate at which available homes are sold in a specific market during a given time period.
- 2.32,2.23,2.1,2.01,1.96,1.96,2.18,2.5,2.75,2.73,2.74,2.93
Information is deemed to be reliable, but is not guaranteed. © 2024
Have questions or need a market analysis for your current home? Contact us using the form below, or call 480-748-4079.
