Real estate market report for the greater Phoenix, AZ metro area.
Or, if you prefer to search by City or <Zip Code>, please select one of those options
National Real Estate Statistics
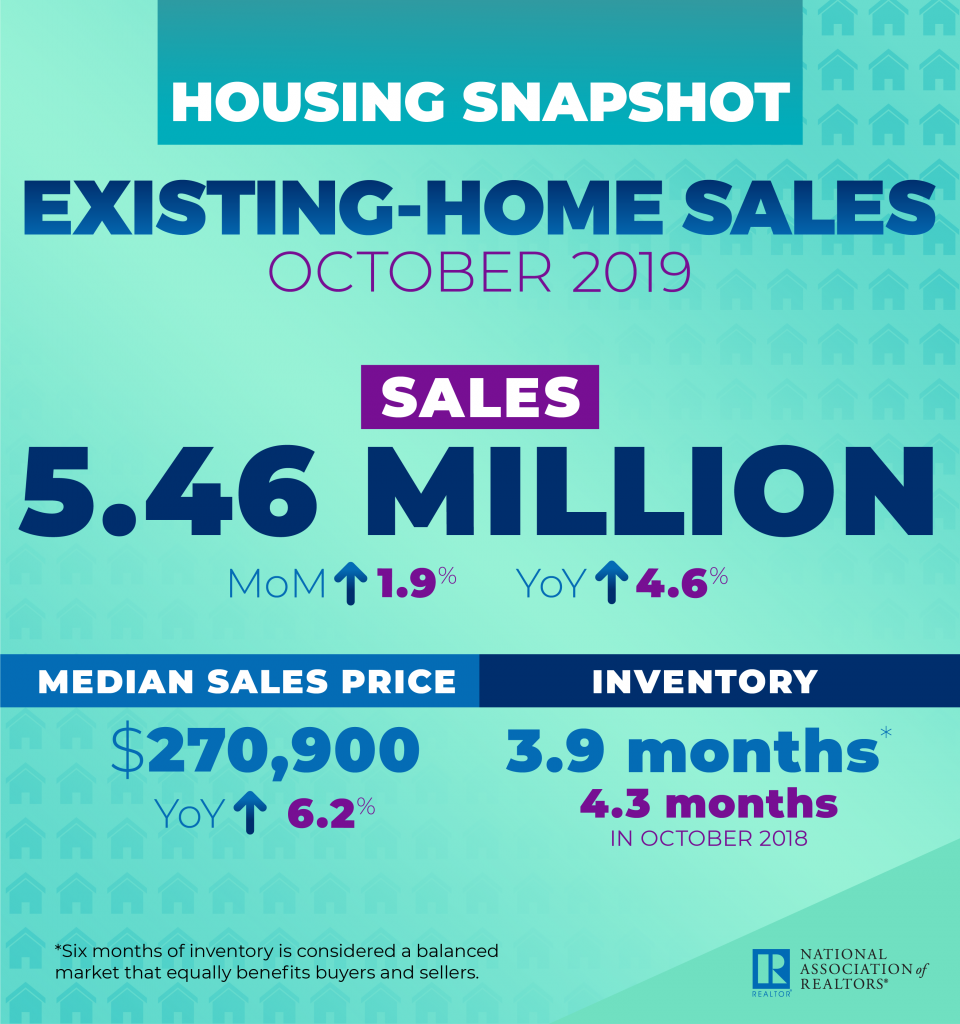
The National Association of Realtors® reported that existing home sales increased 1.9% in October 2019 to 5.46 million following a decline in September. Despite variances regionally, the overall sales are up 4.6% from a year ago (5.22 million in October 2018).
The median single-family home list price in October 2019 was $270,900, up 6.2% from October 2018 which was $255,100. The year over year price increase in October marks 92 months in a row of gains.
Nationwide the total unsold inventory at the end of October 2019 decreased slightly to 3.9 months of supply (4.1 in September 2019, and 4.3 in October 2018).
National average days on market increased to 36 days, from 32 days in September, and the same as October 2018.
The percentage of total sales for first-time homebuyers decreased slightly to 31%, and the percentage of individual investor purchases, which are typically all-cash sales, stayed the same at 14% in October 2019. Distressed (foreclosure or short sale) sales percentage remains at 2%.
“It is great to see home sales rise along with an increase in housing permits,” said NAR President Vince Malta, a broker at Malta & Co., Inc., in San Francisco, CA. “Both home buyers and the home sellers are being rewarded by these developments, and we see that conditions remain extremely favorable for real estate investment in America.”
October 2019 Maricopa County Statistics
October 2019 Pinal County Statistics
Phoenix Metro Area Statistics
In the greater Phoenix metro area serviced by the Arizona Regional Multiple Listing System, ARMLS, the October 2019 median list price average was $300,000. The median sales price for October 2019 was $285,000 and is expected to decrease slightly in November following seasonal trends.
Days on market in the greater Phoenix area in October 2019 stayed the same at 59, which is lower than October 2018 at 61.
Months supply of inventory in the Phoenix metro area is following the season trend increasing slightly from 2.27 in September 2019 to 2.35 in October 2019. Low inventory continues to drive price appreciation in most markets within the Phoenix metro area.
| Month Year | Median Price | Average Price | Active | Under Contract | Sold | Months Supply | DOM |
| Oct-2019 | $285,000 | $345,100 | 14427 | 9950 | 7848 | ||
| Sept-19 | $280,000 | $333,700 | 13936 | 9694 | 7850 | 2.27 | 59 |
| Aug-19 | $280,000 | $338,700 | 13350 | 10493 | 8726 | 2.0 | 63 |
| July-19 | $280,000 | $341,600 | 18007 | 10855 | 9192 | 1.96 | 63 |
| June-19 | $279,900 | $350,600 | 19778 | 10972 | 9313 | 2.12 | 65 |
| May-19 | $278,000 | $389,200 | 21386 | 12289 | 10341 | 2.07 | 65 |
| Apr-19 | $270,000 | $339,900 | 23084 | 12536 | 9493 | 2.43 | 69 |
| Mar-19 | $267,000 | $338,000 | 23164 | 11995 | 8344 | 2.78 | 72 |
| Feb-19 | $264,000 | $326,800 | 23271 | 10843 | 6409 | 3.63 | 73 |
| Jan-19 | $262,100 | $326,100 | 22903 | 9247 | 5357 | 4.28 | 72 |
| Dec-18 | $262,000 | $326,000 | 20694 | 6441 | 6403 | 3.23 | 68 |
| Nov-18 | $262,000 | $326,500 | 21477 | 8030 | 6515 | 3.3 | 64 |
| Oct-18 | $262,000 | $324,300 | 21742 | 8307 | 7182 | 3.03 | 61 |
| Sep-18 | $260,000 | $317,500 | 20200 | 8591 | 6897 | 2.93 | 63 |
| Aug-18 | $263,000 | $322,800 | 19822 | 9193 | 8036 | 2.47 | 62 |
| Jul-18 | $265,000 | $320,500 | 19755 | 9135 | 8380 | 2.36 | 60 |
| Jun-18 | $268,000 | $333,600 | 20357 | 10618 | 9079 | 2.24 | 62 |
| May-18 | $265,000 | $331,000 | 20676 | 11630 | 9913 | 2.09 | 63 |
| Apr-18 | $ 254,000 | $ 322,000 | 21772 | 12309 | 8990 | 2.42 | 66 |
| Mar-18 | $254,000 | $316,400 | 21703 | 12319 | 9402 | 2.31 | 72 |
| Feb-18 | $252,500 | $308,000 | 21771 | 12161 | 6911 | 3.18 | 76 |
| Jan-18 | $245,000 | $315,300 | 21664 | 10696 | 6082 | 3.56 | 77 |
Maricopa County Total Inventory vs New Inventory
- 12726,11845,10799,10203,9906,9837,10916,12325,13524,13334,13347,14249
- 6789,6266,6228,5949,5487,6226,6387,6632,5636,4268,7555,7160
Information is deemed to be reliable, but is not guaranteed. © 2024
Maricopa County Absorption Rate
The absorption rate is calculated by dividing the average number of sales per month by the total number of available homes. This shows the rate at which available homes are sold in a specific market during a given time period.
- 2.32,2.23,2.1,2.01,1.96,1.96,2.18,2.5,2.75,2.73,2.74,2.93
Information is deemed to be reliable, but is not guaranteed. © 2024
Have questions or need a market analysis for your current home? Contact us using the form below, or call 480-748-4079.
