Real estate market report for the greater Phoenix, AZ metro area.
Or, if you prefer to search by City or <Zip Code>, please select one of those options
National Real Estate Statistics
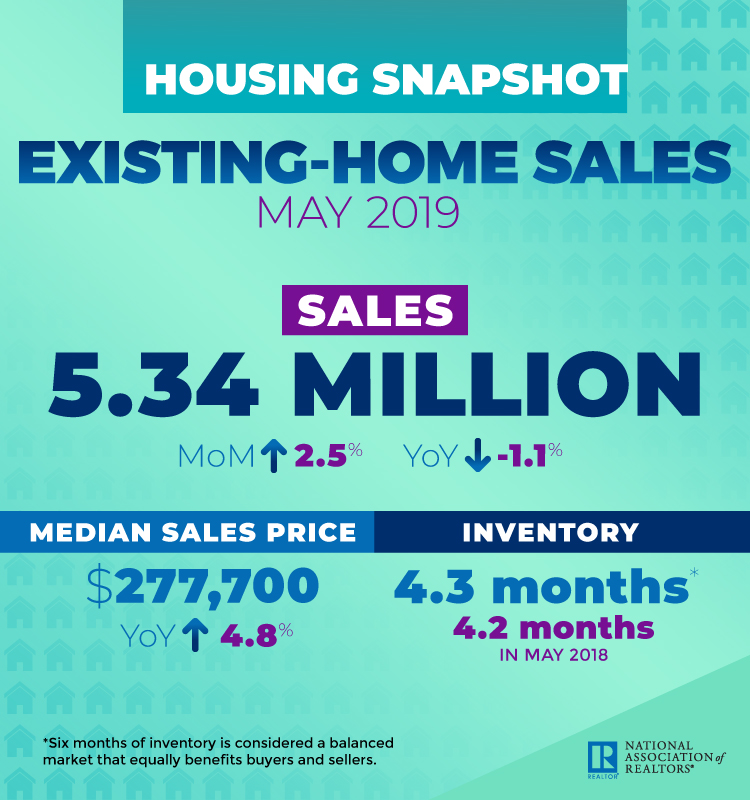
The National Association of Realtors® reported that existing home sales increased for the first time in two months to 5.34 million in sales, and the median single-family home list price in May 2019 increased as well, to $277,700, up from May 2018 which was $265,100. Nationwide the total inventory at the end of May grew slightly to 4.3 months of supply.
Properties remained on the market for an average of 26 days nationally in May 2019, which was slightly higher than April’s average of 24, and equal to May 2018.
“ More new homes need to be built,” said Lawrence Yun, NAR’s chief economist. “Otherwise, we risk worsening the housing shortage, and an increasing number of middle-class families will be unable to achieve homeownership.”
Maricopa County Statistics
Pinal County Statistics
Phoenix Metro Area Statistics
In the greater Phoenix metro area serviced by the Arizona Regional Multiple Listing System, ARMLS, the May 2019 median list price average set a record high at $278,000, which is significantly higher than the May 2018 median, $265,000. The median sales price is expected to increase in June, then fluctuate slightly throughout the remainder of the year.
Days on market in the greater Phoenix area in May was 65, which is slightly up from May 2018 at 63.
Inventory continues to go down in the Phoenix metro area, with 2.07 month’s supply reported for May 2019. April 2019 was at 2.43 month. Low inventory continues to drive price appreciation in most markets within the Phoenix metro area.
| Month Year | Median Price | Average Price | Active | Under Contract | Sold | Months Supply | DOM |
| May-19 | 278000 | 389200 | 21386 | 12289 | 10341 | 2.07 | 65 |
| Apr-19 | 270000 | 339900 | 23084 | 12536 | 9493 | 2.43 | 69 |
| Mar-19 | 267,000 | 338,000 | 23164 | 11995 | 8344 | 2.78 | 72 |
| Feb-19 | $264,000 | $326,800 | 23271 | 10843 | 6409 | 3.63 | 73 |
| Jan-19 | $262,100 | $326,100 | 22903 | 9247 | 5357 | 4.28 | 72 |
| Dec-18 | $262,000 | $326,000 | 20694 | 6441 | 6403 | 3.23 | 68 |
| Nov-18 | $262,000 | $326,500 | 21477 | 8030 | 6515 | 3.3 | 64 |
| Oct-18 | $262,000 | $324,300 | 21742 | 8307 | 7182 | 3.03 | 61 |
| Sep-18 | $260,000 | $317,500 | 20200 | 8591 | 6897 | 2.93 | 63 |
| Aug-18 | $263,000 | $322,800 | 19822 | 9193 | 8036 | 2.47 | 62 |
| Jul-18 | $265,000 | $320,500 | 19755 | 9135 | 8380 | 2.36 | 60 |
| Jun-18 | $268,000 | $333,600 | 20357 | 10618 | 9079 | 2.24 | 62 |
| May-18 | $265,000 | $331,000 | 20676 | 11630 | 9913 | 2.09 | 63 |
| Apr-18 | $ 254,000 | $ 322,000 | 21772 | 12309 | 8990 | 2.42 | 66 |
| Mar-18 | $254,000 | $316,400 | 21703 | 12319 | 9402 | 2.31 | 72 |
| Feb-18 | $252,500 | $308,000 | 21771 | 12161 | 6911 | 3.18 | 76 |
| Jan-18 | $245,000 | $315,300 | 21664 | 10696 | 6082 | 3.56 | 77 |
Maricopa County Total Inventory vs New Inventory
- 12726,11845,10799,10203,9906,9837,10916,12325,13524,13334,13347,14249
- 6789,6266,6228,5949,5487,6226,6387,6632,5636,4268,7555,7160
Information is deemed to be reliable, but is not guaranteed. © 2024
Maricopa County Absorption Rate
The absorption rate is calculated by dividing the average number of sales per month by the total number of available homes. This shows the rate at which available homes are sold in a specific market during a given time period.
- 2.32,2.23,2.1,2.01,1.96,1.96,2.18,2.5,2.75,2.73,2.74,2.93
Information is deemed to be reliable, but is not guaranteed. © 2024
Have questions or need a market analysis for your current home? Contact us using the form below, or call 480-748-4079.
