Real estate market report for the greater Phoenix, AZ metro area.
Or, if you prefer to search by City or <Zip Code>, please select one of those options
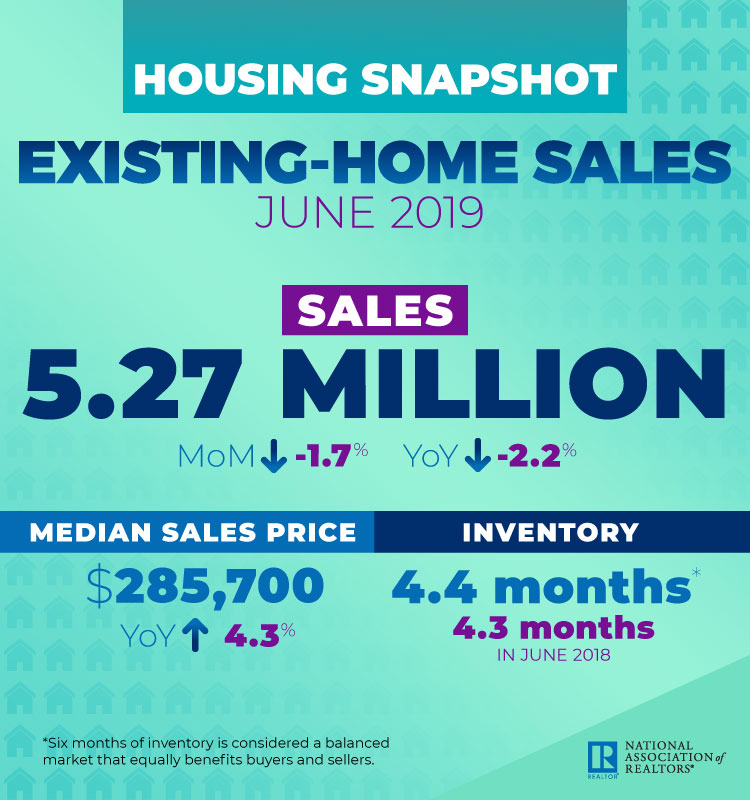
National Real Estate Statistics
The National Association of Realtors® reported that existing home sales weakened slightly in June 2019 to 5.27 million in sales, and the median single-family home list price in June 2019 reached an all-time high of $285,700 as well, up 4.3% from June 2018 which was $273,800. Nationwide the total inventory at the end of June grew slightly to 4.4 months of supply. National average days on market increased slightly to 27 days, from 26 days in May. The percentage of total sales for first-time homebuyers rose to 35%, and the percentage of individual investor purchases, which are typically all-cash sales, decreased slightly to 10%. Distressed (foreclosure or short sale) sales percentage remained unchanged at 3%.
Lawrence Yun, NAR’s chief economist said “ Home sales are running at a pace similar to 2015 levels – even with exceptionally low mortgage rates, a record number of jobs and a record high net worth in the country”. He also said “Imbalance persists for mid-to-lower priced homes with solid demand and insufficient supply, which is consequently pushing up home prices”
Maricopa County Statistics
Pinal County Statistics
Phoenix Metro Area Statistics
In the greater Phoenix metro area serviced by the Arizona Regional Multiple Listing System, ARMLS, the June 2019 median list price average was $279,900, which was higher than the May 2018 median, $278,000. The median sales price is expected to increase in July, then fluctuate slightly throughout the remainder of the year.
Days on market in the greater Phoenix area in June remains at 65, which is slightly up from June 2018 at 62.
Inventory in the Phoenix metro area is up slightly from 2.07 in May 2019 and 2.12 month’s supply reported for June 2019. Low inventory continues to drive price appreciation in most markets within the Phoenix metro area.
| Month Year | Median Price | Average Price | Active | Under Contract | Sold | Months Supply | DOM |
| June-19 | 279900 | 350600 | 19778 | 10972 | 9313 | 2.12 | 65 |
| May-19 | 278000 | 389200 | 21386 | 12289 | 10341 | 2.07 | 65 |
| Apr-19 | 270000 | 339900 | 23084 | 12536 | 9493 | 2.43 | 69 |
| Mar-19 | 267,000 | 338,000 | 23164 | 11995 | 8344 | 2.78 | 72 |
| Feb-19 | $264,000 | $326,800 | 23271 | 10843 | 6409 | 3.63 | 73 |
| Jan-19 | $262,100 | $326,100 | 22903 | 9247 | 5357 | 4.28 | 72 |
| Dec-18 | $262,000 | $326,000 | 20694 | 6441 | 6403 | 3.23 | 68 |
| Nov-18 | $262,000 | $326,500 | 21477 | 8030 | 6515 | 3.3 | 64 |
| Oct-18 | $262,000 | $324,300 | 21742 | 8307 | 7182 | 3.03 | 61 |
| Sep-18 | $260,000 | $317,500 | 20200 | 8591 | 6897 | 2.93 | 63 |
| Aug-18 | $263,000 | $322,800 | 19822 | 9193 | 8036 | 2.47 | 62 |
| Jul-18 | $265,000 | $320,500 | 19755 | 9135 | 8380 | 2.36 | 60 |
| Jun-18 | $268,000 | $333,600 | 20357 | 10618 | 9079 | 2.24 | 62 |
| May-18 | $265,000 | $331,000 | 20676 | 11630 | 9913 | 2.09 | 63 |
| Apr-18 | $ 254,000 | $ 322,000 | 21772 | 12309 | 8990 | 2.42 | 66 |
| Mar-18 | $254,000 | $316,400 | 21703 | 12319 | 9402 | 2.31 | 72 |
| Feb-18 | $252,500 | $308,000 | 21771 | 12161 | 6911 | 3.18 | 76 |
| Jan-18 | $245,000 | $315,300 | 21664 | 10696 | 6082 | 3.56 | 77 |
Maricopa County Total Inventory vs New Inventory
- 12726,11845,10799,10203,9906,9837,10916,12325,13524,13334,13347,14249
- 6789,6266,6228,5949,5487,6226,6387,6632,5636,4268,7555,7160
Information is deemed to be reliable, but is not guaranteed. © 2024
Maricopa County Absorption Rate
The absorption rate is calculated by dividing the average number of sales per month by the total number of available homes. This shows the rate at which available homes are sold in a specific market during a given time period.
- 2.32,2.23,2.1,2.01,1.96,1.96,2.18,2.5,2.75,2.73,2.74,2.93
Information is deemed to be reliable, but is not guaranteed. © 2024
Have questions or need a market analysis for your current home? Contact us using the form below, or call 480-748-4079.
