Real estate market report for the greater Phoenix, AZ metro area.
Or, if you prefer to search by City or <Zip Code>, please select one of those options
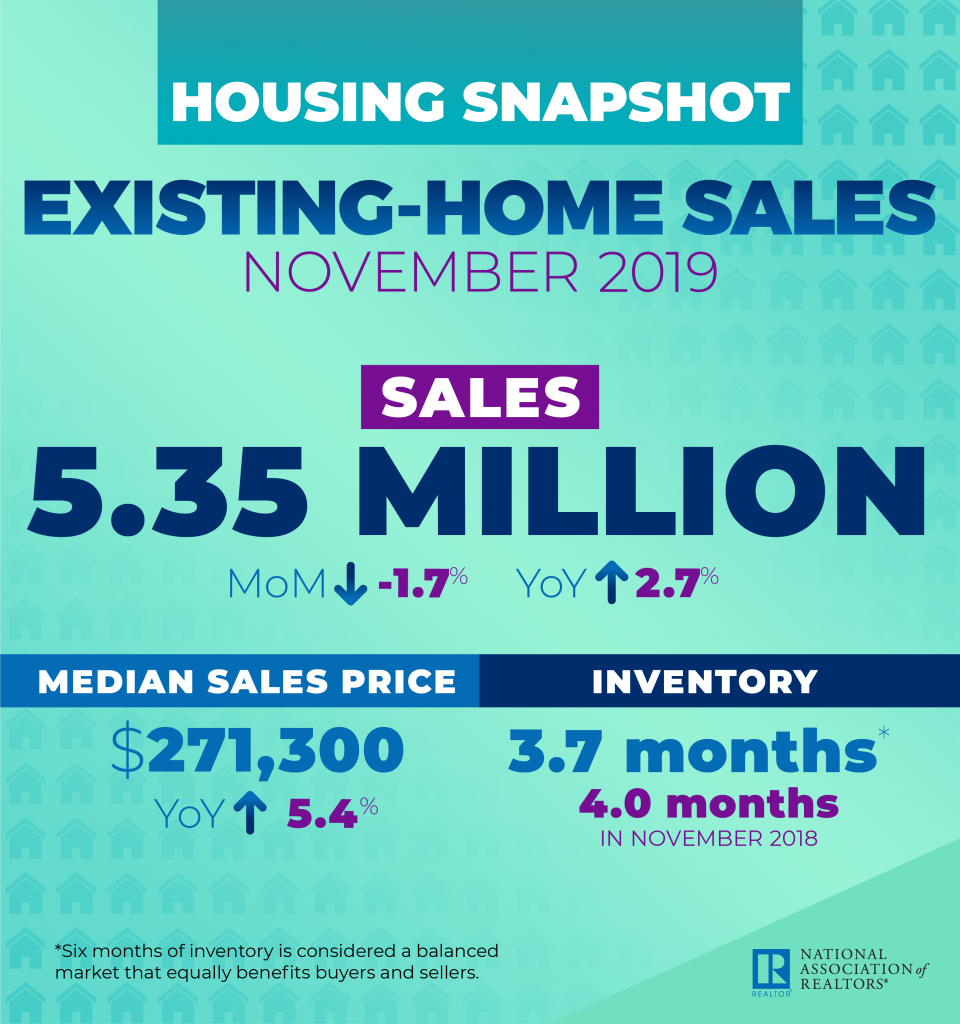
National Real Estate Statistics
The National Association of Realtors® reported that existing home sales decreased 1.7% in November 2019 to 5.35 million following a small gain in October. Despite variances regionally, the overall sales are up 2.7% from a year ago (5.21 million in November 2018).
The median single-family home list price in November 2019 was $271,300, up 5.4% from November 2018 which was $257,400. The year over year price increase in November marks 93 months in a row of gains.
Nationwide the total unsold inventory at the end of November 2019 decreased slightly to 3.7 months of supply (3.9 in October 2019, and 4.0 in November 2018).
National average days on market increased to 38 days, from 36 days in October, and lower than November 2018 at 42.
The percentage of total sales for first-time homebuyers increased slightly to 32%, and the percentage of individual investor purchases, which are typically all-cash sales, increased to 16% in November 2019. Distressed (foreclosure or short sale) sales percentage remains at 2%.
Lawrence Yun, NAR’s chief economist, stated November’s lower number of sales isn’t anything to worry about. “Sales will be choppy when inventory levels are low, but the economy is otherwise performing very well with more than 2 million job gains in the past year,” said Yun.
“The consensus was that mortgage rates may rise, but only incrementally,” Yun said. “I expect to see home price affordability improvements, too. This year we witnessed housing costs grow faster than income, but the expectation is for prices to settle at a more reasonable level in the coming year in line with average hourly wage growth of 3% on a year-over-year basis.”
November 2019 Maricopa County Statistics
November 2019 Pinal County Statistics
Phoenix Metro Area Statistics
In the greater Phoenix metro area serviced by the Arizona Regional Multiple Listing System, ARMLS, the November 2019 median list price was $300,000. The median sales price for November 2019 was $283,500 and which as expected is slightly lower than October following seasonal trends.
Days on market in the greater Phoenix area in November 2019 decreased to 58, which is lower than November 2018 at 64.
Months supply of inventory in the Phoenix metro area is following the season trend increasing slightly from 2.35 in October 2019 to 2.49 in November 2019. Low inventory continues to drive price appreciation in most markets within the Phoenix metro area.
| Month Year | Median Price | Average Price | Active | Under Contract | Sold | Months Supply | DOM |
| Nov-2019 | $283,500 | $354,900 | 13675 | 9359 | 6974 | 2.49 | 58 |
| Oct-2019 | $285,000 | $345,100 | 14427 | 9950 | 7848 | 2.35 | 59 |
| Sept-19 | $280,000 | $333,700 | 13936 | 9694 | 7850 | 2.27 | 59 |
| Aug-19 | $280,000 | $338,700 | 13350 | 10493 | 8726 | 2.0 | 63 |
| July-19 | $280,000 | $341,600 | 18007 | 10855 | 9192 | 1.96 | 63 |
| June-19 | $279,900 | $350,600 | 19778 | 10972 | 9313 | 2.12 | 65 |
| May-19 | $278,000 | $389,200 | 21386 | 12289 | 10341 | 2.07 | 65 |
| Apr-19 | $270,000 | $339,900 | 23084 | 12536 | 9493 | 2.43 | 69 |
| Mar-19 | $267,000 | $338,000 | 23164 | 11995 | 8344 | 2.78 | 72 |
| Feb-19 | $264,000 | $326,800 | 23271 | 10843 | 6409 | 3.63 | 73 |
| Jan-19 | $262,100 | $326,100 | 22903 | 9247 | 5357 | 4.28 | 72 |
| Dec-18 | $262,000 | $326,000 | 20694 | 6441 | 6403 | 3.23 | 68 |
| Nov-18 | $262,000 | $326,500 | 21477 | 8030 | 6515 | 3.3 | 64 |
| Oct-18 | $262,000 | $324,300 | 21742 | 8307 | 7182 | 3.03 | 61 |
| Sep-18 | $260,000 | $317,500 | 20200 | 8591 | 6897 | 2.93 | 63 |
| Aug-18 | $263,000 | $322,800 | 19822 | 9193 | 8036 | 2.47 | 62 |
| Jul-18 | $265,000 | $320,500 | 19755 | 9135 | 8380 | 2.36 | 60 |
| Jun-18 | $268,000 | $333,600 | 20357 | 10618 | 9079 | 2.24 | 62 |
| May-18 | $265,000 | $331,000 | 20676 | 11630 | 9913 | 2.09 | 63 |
| Apr-18 | $ 254,000 | $ 322,000 | 21772 | 12309 | 8990 | 2.42 | 66 |
| Mar-18 | $254,000 | $316,400 | 21703 | 12319 | 9402 | 2.31 | 72 |
| Feb-18 | $252,500 | $308,000 | 21771 | 12161 | 6911 | 3.18 | 76 |
| Jan-18 | $245,000 | $315,300 | 21664 | 10696 | 6082 | 3.56 | 77 |
Maricopa County Total Inventory vs New Inventory
- 12726,11845,10799,10203,9906,9837,10916,12325,13524,13334,13347,14249
- 6789,6266,6228,5949,5487,6226,6387,6632,5636,4268,7555,7160
Information is deemed to be reliable, but is not guaranteed. © 2024
Maricopa County Absorption Rate
The absorption rate is calculated by dividing the average number of sales per month by the total number of available homes. This shows the rate at which available homes are sold in a specific market during a given time period.
- 2.32,2.23,2.1,2.01,1.96,1.96,2.18,2.5,2.75,2.73,2.74,2.93
Information is deemed to be reliable, but is not guaranteed. © 2024
Have questions or need a market analysis for your current home? Contact us using the form below, or call 480-748-4079.
