2019 Phoenix Area Pumpkin Patches

Tis the season for all things pumpkin! Now that temps are under 100, it’s time to get into the fall-spirit and enjoy the many great outdoor activities in the Valley of the Sun.
Below is a list of pumpkin patches in the Phoenix area open through the end of October, and a few into early November. Enjoy pumpkin carving, hayrides, food, and fun! Happy Fall to Y’all!
26540 N Scottsdale Rd
Scottsdale, AZ 85255
Through October 31st*
Monday – Sunday 9:00 am – 6:00 pm**
*Closes 1:00 pm on 31st **entry closes at 5 pm
$2 off coupon on website
480-585-0239
1663 E Baseline Rd
Gilbert, AZ 85233
Through October 31st
Monday – Sunday 9:00 am – 9:00 pm
Can Reserve Online
480-892-5874
Mortimer Farms Pumpkin Festival & Corn Maze
12907 E. State Rt. 169
Dewey, Arizona 86327
Through October 27th
8:00 am – 6:00 pm
928-830-1116
More info online
19601 W Broadway Rd.
Buckeye, AZ 85326
Through November 3rd
Hours vary. See website for details.
623-208-8676
24810 S Rittenhouse Rd
Queen Creek, AZ 85142
Through October 27th
10:00 am – 10:00 pm*
*Closes at 9 pm on Thursdays and Sundays
Can purchase tickets online & discounts maybe available
480-987-3100
Locations:
McDowell/99th Av
1819 N 99th Av
Phoenix, AZ 85037
Higley/Guadalupe
700 N Highley Rd
Gilbert, AZ 85204
Through October 31st
9:00 am – 9:00 pm
623-218-4800
More info online
5726 N 75th Av
Glendale, AZ 85303
Through November 4th
Hours vary – see website for details.
$2 off coupon on website
602-999-3276
October 2019 Real Estate Advisor Newsletter
the real estate Advisor
Ready to go Rustic

Rustic and farmhouse interior design are still in, and it isn’t going anywhere any time soon! If you’re ready to hop on board this trend, try introducing some of our favorite ideas into a room in your home. Take a look below!
Exposed wood. Whether you implement this in a small way, such as a coffee table, headboard, or chair, or go big with your remodel and add wooden beams or create a plank accent wall, exposed wood is essential to a rustic-style room. Make sure to combine various wood grains, colors, and finishes to add more depth and texture.
Fur. Whether you opt for real or faux, fur can be a unique feature piece and can bring together the room. Try a cowhide, bear, or sheepskin rug or purchase a fur throw for a couch or chair.
Accent materials. Incorporate iron or stone accents in furniture and décor, such as bar stools, coffee tables, overhead lighting, chandeliers, fireplaces, mantels, shelving, candleholders, and more.
Warm lighting. To give the room a cozy, relaxing feel, lean towards warm, yellow lightbulbs instead of LEDs or pick out some unique Edison bulbs for exposed lamps and decorative overhead lighting.
Small details. The magic is in the small details. Paint wood panels white or gray and letter your favorite saying on top. Purchase wooden picture frames, farmhouse signs, terracotta pots, wood slices, and mason jars and arrange them around the room.
Bold patterns. Mismatched quilts, layered rag rugs, and check-print chairs or blankets are great additions to any rustic room.
Take 5: Catching a Leak
One of the more challenging parts of being a homeowner is when something goes wrong or breaks, you’re in charge of fixing it. And unfortunately, one of the most common issues can be the hardest to detect — a plumbing leak. Here are 5 tips for catching a leak.
Review your water bill carefully. Have you noticed that your most recent bills have been unusually high but you haven’t changed your regular routine at all? This can be a telling sign that you may have a leak in your home. Pay attention to water pressure. Although a shift in water pressure in your shower or kitchen sink can be caused by a clogged pipe, it’s crucial to rule out a leak. Check below your sinks. A great habit to get into is routinely checking under bathroom, kitchen, and laundry room sinks to ensure you don’t have a slow drip. Not only will this warp your cabinetry and cause mold, but it can cost you a lot of money over time. Inspect flooring, walls, and ceilings. Peeling paint or stains on walls or ceilings is an indicator that there might be some damage behind them. Make sure you regularly check the floors and sealant around appliances like tubs, toilets, refrigerators, and more for cracks or spongy areas as well. Don’t neglect basements and crawl spaces. “Out of sight, out of mind” could really cause a major issue for you and your home in this case. Make sure you set a reminder to periodically check your house for mold, corrosion, and moisture before you are dealing with foundation damage.
Doggy Door Safety
You’ve purchased a home with a large backyard and all your pup wants to do is be outside. But after the 10th time you have to get up and open the door to let him or her in and out, you start researching doggy doors. Long-term convenience with a fairly simple installation sounds great to you! However, before committing, you should consider how it may affect the safety of your home.
A doggy door is a home feature that can make your house more susceptible to burglary. These doors are almost always placed in a back door or wall of the home, putting it out of the line of sight for passing traffic and neighbors. If a robber is small enough, they may be able to slip right through the door or use it to reach in and unlock the door.
As long as you remain conscious and aware of the safety implications, there are several ways to secure your doggy door, keeping convenience in place while protecting you and your family. The first and easiest option is to select a door that includes a sliding bolt or has a self-locking feature. If you have a security system in place, you can have the design adjusted to include the doggy door and surrounding area. Many of these systems include sensors and cameras intelligent enough to ignore your pet’s body weight or shape but pick up on anything else. Alternatively, you could install a motion detector that will signal you on your phone or report to your security company if someone is coming in and out of your home when engaged.
August 2019 Market Statistics
The market statistics are for Maricopa and Pinal Counties. Please let me know if you’d like similar statistics for a specific city or neighborhood within the Phoenix Metro area.
Contact me today at 602-527-1922 to schedule a free consultation.
To view earlier versions of the newsletter, please use the button below.
Real Estate Market Report – August 2019
Real estate market report for the greater Phoenix, AZ metro area.
Or, if you prefer to search by City or <Zip Code>, please select one of those options
National Real Estate Statistics
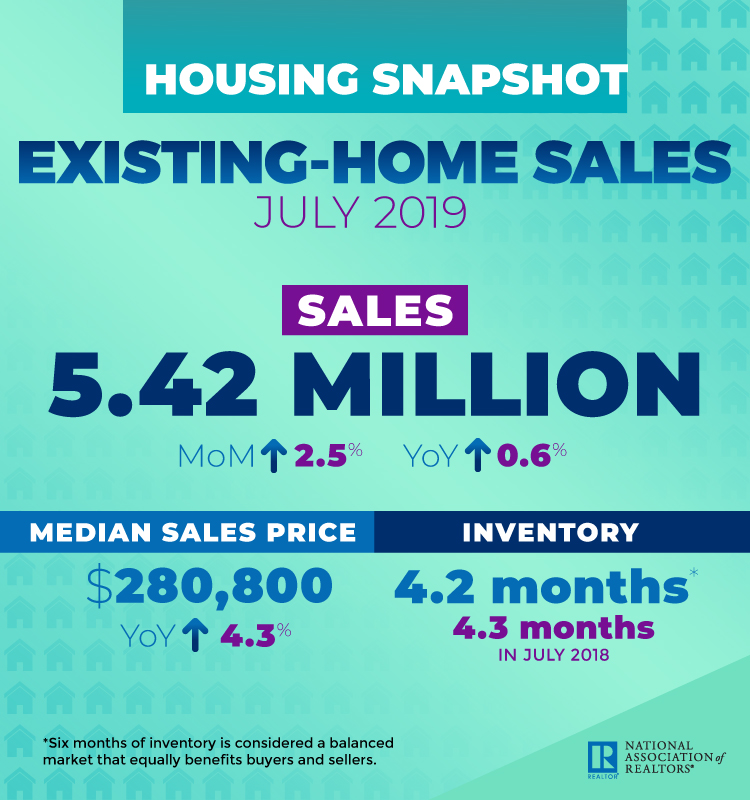
The National Association of Realtors® reported that existing home sales strengthened in July 2019 to 5.42 million in sales, up 0.6% from a year ago, and the median single-family home list price in July 2019 was $280,800, up 4.3% from July 2018 which was $269,300. Nationwide the total unsold inventory at the end of July decreased to 4.2 months of supply. National average days on market increased to 29 days, from 27 days in July 2018. The percentage of total sales for first-time homebuyers fell slightly to 32%, and the percentage of individual investor purchases, which are typically all-cash sales, increased slightly to 11%. Distressed (foreclosure or short sale) sales percentage went down slightly to 2%.
John Smaby, NAR President, said “ Present rates have opened the market for a number of potential buyers who couldn’t afford a home just a year ago”. He also said “ Additionally, NAR has been working with the FHA for years to establish new condominium loan policies. Our hard work has paid off, and this change will begin benefiting buyers, sellers and our members as soon as this fall. ”
August 2019 Maricopa County Statistics
August 2019 Pinal County Statistics
Phoenix Metro Area Statistics
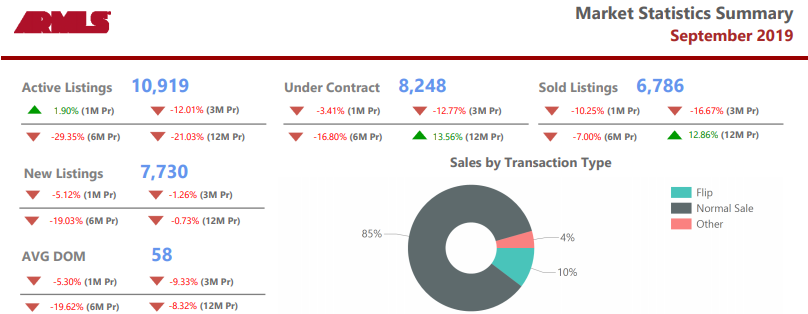
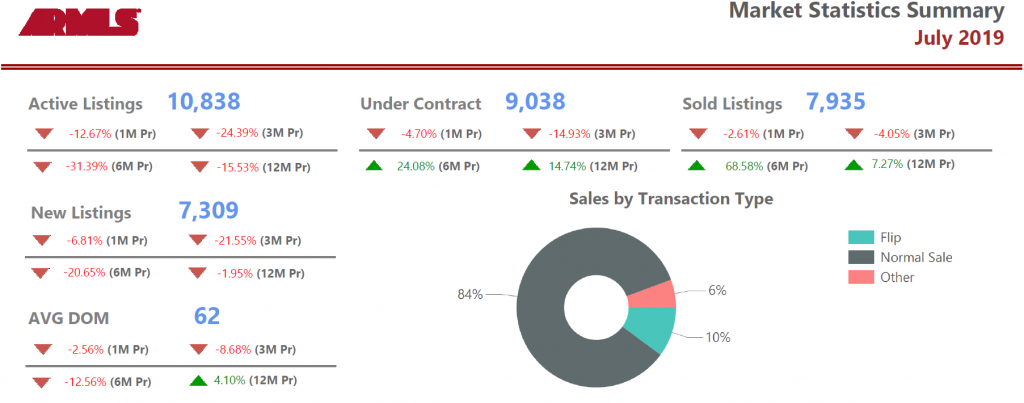
In the greater Phoenix metro area serviced by the Arizona Regional Multiple Listing System, ARMLS, the July 2019 median list price average was $280,000. The median sales price is expected to remain the same for August.
Days on market in the greater Phoenix area in July went down to 63, which is slightly up from July 2018 at 60.
Inventory in the Phoenix metro area is down slightly from 2.12 in June 2019 to 1.96 month’s supply reported for July 2019. Low inventory continues to drive price appreciation in most markets within the Phoenix metro area.
| Month Year | Median Price | Average Price | Active | Under Contract | Sold | Months Supply | DOM |
| July-19 | 280000 | 341600 | 18007 | 10855 | 9192 | 1.96 | 63 |
| June-19 | 279900 | 350600 | 19778 | 10972 | 9313 | 2.12 | 65 |
| May-19 | 278000 | 389200 | 21386 | 12289 | 10341 | 2.07 | 65 |
| Apr-19 | 270000 | 339900 | 23084 | 12536 | 9493 | 2.43 | 69 |
| Mar-19 | 267,000 | 338,000 | 23164 | 11995 | 8344 | 2.78 | 72 |
| Feb-19 | $264,000 | $326,800 | 23271 | 10843 | 6409 | 3.63 | 73 |
| Jan-19 | $262,100 | $326,100 | 22903 | 9247 | 5357 | 4.28 | 72 |
| Dec-18 | $262,000 | $326,000 | 20694 | 6441 | 6403 | 3.23 | 68 |
| Nov-18 | $262,000 | $326,500 | 21477 | 8030 | 6515 | 3.3 | 64 |
| Oct-18 | $262,000 | $324,300 | 21742 | 8307 | 7182 | 3.03 | 61 |
| Sep-18 | $260,000 | $317,500 | 20200 | 8591 | 6897 | 2.93 | 63 |
| Aug-18 | $263,000 | $322,800 | 19822 | 9193 | 8036 | 2.47 | 62 |
| Jul-18 | $265,000 | $320,500 | 19755 | 9135 | 8380 | 2.36 | 60 |
| Jun-18 | $268,000 | $333,600 | 20357 | 10618 | 9079 | 2.24 | 62 |
| May-18 | $265,000 | $331,000 | 20676 | 11630 | 9913 | 2.09 | 63 |
| Apr-18 | $ 254,000 | $ 322,000 | 21772 | 12309 | 8990 | 2.42 | 66 |
| Mar-18 | $254,000 | $316,400 | 21703 | 12319 | 9402 | 2.31 | 72 |
| Feb-18 | $252,500 | $308,000 | 21771 | 12161 | 6911 | 3.18 | 76 |
| Jan-18 | $245,000 | $315,300 | 21664 | 10696 | 6082 | 3.56 | 77 |
Maricopa County Total Inventory vs New Inventory
- 12726,11845,10799,10203,9906,9837,10916,12325,13524,13334,13347,14249
- 6789,6266,6228,5949,5487,6226,6387,6632,5636,4268,7555,7160
Information is deemed to be reliable, but is not guaranteed. © 2024
Maricopa County Absorption Rate
The absorption rate is calculated by dividing the average number of sales per month by the total number of available homes. This shows the rate at which available homes are sold in a specific market during a given time period.
- 2.32,2.23,2.1,2.01,1.96,1.96,2.18,2.5,2.75,2.73,2.74,2.93
Information is deemed to be reliable, but is not guaranteed. © 2024
Have questions or need a market analysis for your current home? Contact us using the form below, or call 480-748-4079.
September 2019 Real Estate Advisor Newsletter
the real estate Advisor
Give Your Deck a Facelift
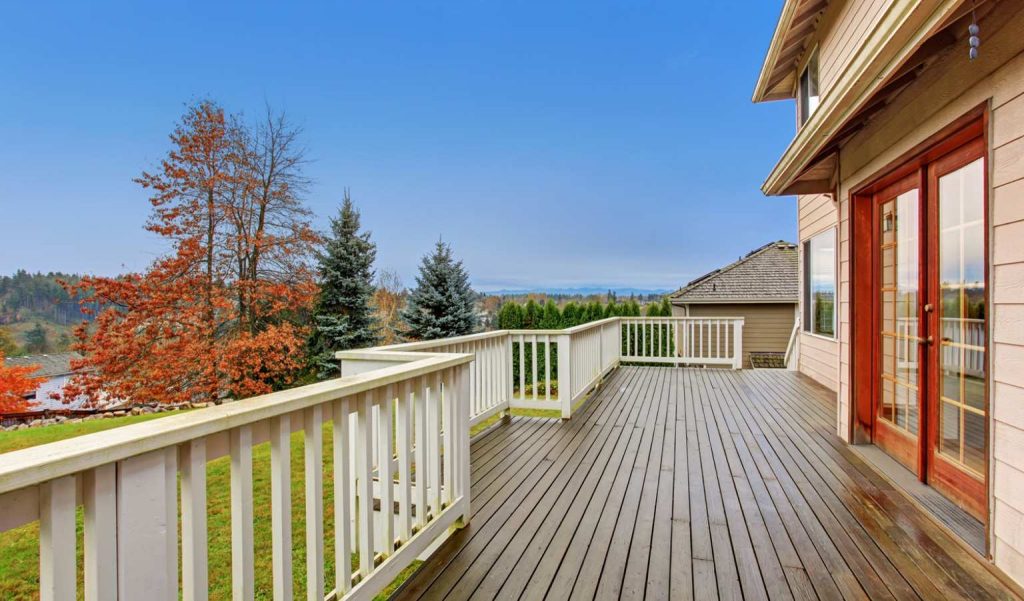
Hanging out with your family or hosting friends on your old, dingy deck is not very appealing. Lucky for you, refreshing it doesn’t have to be difficult or expensive. Try your hand at the makeover ideas below!
Restore your decking. Depending on the shape it’s in, sometimes all your deck needs is a little love. If it’s still fairly new, your deck might just need a deep cleaning and a new coat of sealant. There is a multitude of deck finishing and cleaning solutions on the market to choose from to achieve this. However, if its more worn down, the rejuvenation process may be a bit longer, including searching for larger repairs, tightening any hardware, giving it a good cleaning, applying a stain, sealant, and paint, and more.
Add lighting. Ambient lighting can completely transform your outside space into a relaxing, cozy oasis. Consider adding solar lights that don’t require a plugin or battery replacement. The lights turn on automatically when the sun sets, making your deck come alive. You can also consider paper lanterns, rope lights, mason jar lamps, or small twinkle lights, depending on the style and mood you’d like to set.
Build a privacy screen. Privacy screens come in all styles, shapes, and sizes. Consider purchasing and installing bamboo fencing or lattice panels for a quick and easy solution. Or, if you are feeling a little more adventurous, you can build a wooden frame and grow climbing plants or vines or stretch outdoor fabric in between. Whichever route you end up choosing, make sure you get the most out of your efforts by evaluating all lines sight before building.
Home Equity. Getting a home equity line of credit allows you to borrow money against the value of your home. You receive usually up to 80 percent of your home’s value, minus the amount of your loan.
Retirement Funds. Homeowners can consider pulling money from a 401K or IRA account, even though they aren’t specifically meant to cover a home renovation. This option might incur additional penalties or tax payments, but maybe worth it when making improvements that will benefit them financially in the long run.
Take 5: Top Gardening Tips for Newbies
Feel like trying out your green thumb, but have no clue where to get started. Check out these five tips for newbie gardeners.
- Get to know your soil. To grow a bountiful garden, you must first start with the soil. Determining whether you have loam, clay, or sandy soil can help you select the best flowers, bushes, fruits, vegetables, and more to plant. Try a soil test kit to determine this.
- Play to the sun. Watch the way sunlight moves throughout your yard before choosing your garden plot. A vast majority of edible plants will need at least 6 hours of sun per day to grow properly.
- Determine your frost dates. Don’t kill your garden’s chances of thriving by accidentally planting too early or late in the season. Make sure you know the average spring and fall frost date for your area so you plant at just the right time.
- Keep a close eye on weeds. After all the time and effort you put into planting your garden, the last thing you need is for your plants to be suffocated by weeds. Read up on the common weeds in your area and the safest and best way to rid your garden of them. Make sure to keep a record of these for the years following so you don’t have to repeat your research.
- Water and feed diligently. Morning is the best time to water your garden to allow it to fully soak into the soil before it is evaporated by the sun. Each plant is different so make sure you pay attention so you don’t overwater.
Organize Your Closet Like a Champ
Do you desire a closet that looks like it’s straight out of a magazine? Then we have you covered! Follow the tips below to masterfully organize your closet and give yourself peace of mind.
Group like clothing items together. Group same-length dresses, long-sleeved shirts, blouses, pants, etc. together in your closet to both save space and create an esthetically-pleasing look. Add an extra bar. Need more hanging room? You can find additional closet bars in-store or online for under $20 and installation is fairly quick and easy. Then hang t-shirts, blouses, jackets, and more on the lower bar. Keep things uniform. Although you may have to spend a little more upfront, purchasing matching hangers, organizers, and storage boxes will give your closet a cleaner look. Invest in special hangers, dividers, and organizers. Purchase a few items to make closet organization a breeze, such as a space-saving pants organizer, shelf dividers to keep t-shirts, towels, or sweaters in place, or multi-shirt hangers that can fit up to 5 garments on one. Try color-coding. Feeling magically inspired? Try organizing your closet by color. You can even place the colors in order of the rainbow to help make dressing easier and more fun. Get creative with shoe storage. Shoes can take up a lot of room and keeping the pile neat and tidy can be difficult. Consider purchasing a shoe organizer that hangs on your closet door or install rails on the wall to hang high heels. You can also purchase cubby shelving or a shoe carousel to be placed on the closet floor.
August 2019 Market Statistics
The market statistics are for Maricopa and Pinal Counties. Please let me know if you’d like similar statistics for a specific city or neighborhood within the Phoenix Metro area.
Contact me today at 602-527-1922 to schedule a free consultation.
To view earlier versions of the newsletter, please use the button below.
Real Estate Market Report – July 2019
Real estate market report for the greater Phoenix, AZ metro area.
Or, if you prefer to search by City or <Zip Code>, please select one of those options
National Real Estate Statistics
The National Association of Realtors® reported that existing home sales weakened slightly in June 2019 to 5.27 million in sales, and the median single-family home list price in June 2019 reached an all-time high of $285,700 as well, up 4.3% from June 2018 which was $273,800. Nationwide the total inventory at the end of June grew slightly to 4.4 months of supply. National average days on market increased slightly to 27 days, from 26 days in May. The percentage of total sales for first-time homebuyers rose to 35%, and the percentage of individual investor purchases, which are typically all-cash sales, decreased slightly to 10%. Distressed (foreclosure or short sale) sales percentage remained unchanged at 3%.
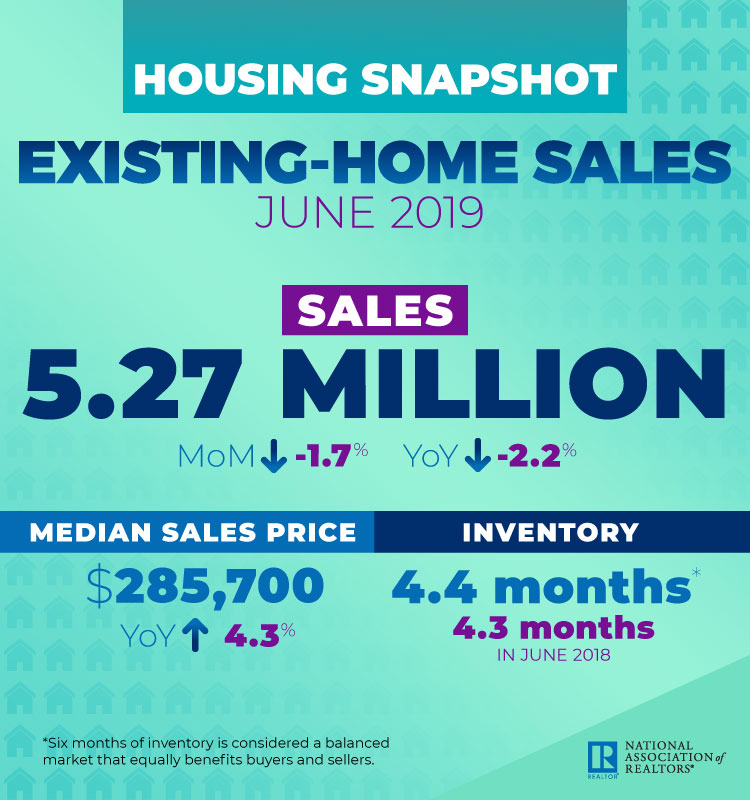
Lawrence Yun, NAR’s chief economist said “ Home sales are running at a pace similar to 2015 levels – even with exceptionally low mortgage rates, a record number of jobs and a record high net worth in the country”. He also said “Imbalance persists for mid-to-lower priced homes with solid demand and insufficient supply, which is consequently pushing up home prices”
Maricopa County Statistics
Pinal County Statistics
Phoenix Metro Area Statistics
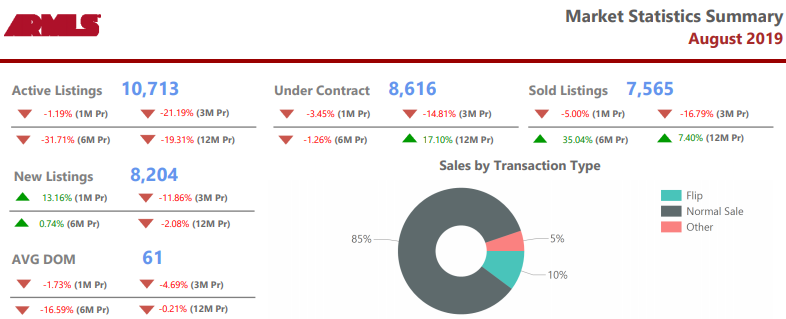
In the greater Phoenix metro area serviced by the Arizona Regional Multiple Listing System, ARMLS, the June 2019 median list price average was $279,900, which was higher than the May 2018 median, $278,000. The median sales price is expected to increase in July, then fluctuate slightly throughout the remainder of the year.
Days on market in the greater Phoenix area in June remains at 65, which is slightly up from June 2018 at 62.
Inventory in the Phoenix metro area is up slightly from 2.07 in May 2019 and 2.12 month’s supply reported for June 2019. Low inventory continues to drive price appreciation in most markets within the Phoenix metro area.
| Month Year | Median Price | Average Price | Active | Under Contract | Sold | Months Supply | DOM |
| June-19 | 279900 | 350600 | 19778 | 10972 | 9313 | 2.12 | 65 |
| May-19 | 278000 | 389200 | 21386 | 12289 | 10341 | 2.07 | 65 |
| Apr-19 | 270000 | 339900 | 23084 | 12536 | 9493 | 2.43 | 69 |
| Mar-19 | 267,000 | 338,000 | 23164 | 11995 | 8344 | 2.78 | 72 |
| Feb-19 | $264,000 | $326,800 | 23271 | 10843 | 6409 | 3.63 | 73 |
| Jan-19 | $262,100 | $326,100 | 22903 | 9247 | 5357 | 4.28 | 72 |
| Dec-18 | $262,000 | $326,000 | 20694 | 6441 | 6403 | 3.23 | 68 |
| Nov-18 | $262,000 | $326,500 | 21477 | 8030 | 6515 | 3.3 | 64 |
| Oct-18 | $262,000 | $324,300 | 21742 | 8307 | 7182 | 3.03 | 61 |
| Sep-18 | $260,000 | $317,500 | 20200 | 8591 | 6897 | 2.93 | 63 |
| Aug-18 | $263,000 | $322,800 | 19822 | 9193 | 8036 | 2.47 | 62 |
| Jul-18 | $265,000 | $320,500 | 19755 | 9135 | 8380 | 2.36 | 60 |
| Jun-18 | $268,000 | $333,600 | 20357 | 10618 | 9079 | 2.24 | 62 |
| May-18 | $265,000 | $331,000 | 20676 | 11630 | 9913 | 2.09 | 63 |
| Apr-18 | $ 254,000 | $ 322,000 | 21772 | 12309 | 8990 | 2.42 | 66 |
| Mar-18 | $254,000 | $316,400 | 21703 | 12319 | 9402 | 2.31 | 72 |
| Feb-18 | $252,500 | $308,000 | 21771 | 12161 | 6911 | 3.18 | 76 |
| Jan-18 | $245,000 | $315,300 | 21664 | 10696 | 6082 | 3.56 | 77 |
Maricopa County Total Inventory vs New Inventory
- 12726,11845,10799,10203,9906,9837,10916,12325,13524,13334,13347,14249
- 6789,6266,6228,5949,5487,6226,6387,6632,5636,4268,7555,7160
Information is deemed to be reliable, but is not guaranteed. © 2024
Maricopa County Absorption Rate
The absorption rate is calculated by dividing the average number of sales per month by the total number of available homes. This shows the rate at which available homes are sold in a specific market during a given time period.
- 2.32,2.23,2.1,2.01,1.96,1.96,2.18,2.5,2.75,2.73,2.74,2.93
Information is deemed to be reliable, but is not guaranteed. © 2024
Have questions or need a market analysis for your current home? Contact us using the form below, or call 480-748-4079.
August 2019 Real Estate Advisor Newsletter
the real estate Advisor
How Can You Finance Your Home Renovation

Outdated kitchen. Overrun backyard. Unusable basement space. If you have a home renovation project on the mind, the first thing you have to consider is how you are going to finance it. Here are the most common options to make your dreams become a reality.
Cash. Paying in cash is the most straightforward financing option, just save until you have enough money to cover the expenses. This will help eliminate spending outside your budget; however, it can also extend your timeline.
Mortgage Refinance. If you’ve been making payments on your home for a few years and your interest rate is higher than current market rates, you may be eligible for a mortgage refinance, reducing your payments and freeing up some money.
Cash-Out Refinance. You can tap into your home equity and borrow up to 80 percent of your home’s value to pay off your current mortgage plus take out more cash to cover the renovations. This option is encouraged only when you’re making improvements that will increase the value of your home, as it can add a lot of interest and fees.
Home Equity. Getting a home equity line of credit allows you to borrow money against the value of your home. You receive usually up to 80 percent of your home’s value, minus the amount of your loan.
Retirement Funds. Homeowners can consider pulling money from a 401K or IRA account, even though they aren’t specifically meant to cover a home renovation. This option might incur additional penalties or tax payments, but may be worth it when making improvements that will benefit them financially in the long run.
Take 5: Going Green Starts in the Kitchen
Living an environmentally-friendly lifestyle and helping to keep our planet clean isn’t as difficult as you may think. All it takes is a few small tweaks. To start, here are five great tips for going green in your kitchen!
Filter your water. Not only does this allow you to remove contaminants like lead, chloroform, chlorine, etc. from your drinking water at home, but you can save money and reduce waste by avoiding bottled water. Choose between a water-filtering pitcher or faucet-mounted option. Reduce water usage. It’s a common misconception that running your dishwasher uses a lot of water, when in fact, it generally uses less than hand washing dishes. Just make sure to only run it when full and use the light wash and air dry settings. You can also purchase a low-flow aerator for your kitchen faucet to cut down on water usage. Avoid unnecessary packaging. When grocery shopping, avoid single-serving products and produce packaged in styrofoam and shrink-wrap to reduce waste. At home, opt for reusable containers, such as jars and Tupperware, instead of foil, plastic wrap, and Ziploc bags. Switch your cooking appliances out. Instead of using your full-size oven, consider using a toaster oven, microwave, or slow cooker instead. These appliances use between 30 to 50 percent less energy to heat. Buy local. Shopping at locally-sourced stores or farmers markets does not only allow you to support your neighbors and community but is sustainable for the environment. The food you purchase does not have to travel far to get to you, helping to reduce carbon emissions.
Spice Up Your Kitchen with a Pop of Color
In the past few years, the biggest kitchen trends revolved around stainless steel appliances, bright white or light gray cupboards, granite countertops, and minimalist decor, maintaining a clean, sleek look. And although this style maintains its popularity among homeowners, color is creeping its way back to the forefront. But it is definitely not how you’d expect.
Introducing the rise of colored appliances. Consumers have been asking and kitchen appliance manufacturers have listened. Instead of your standard white, black, and stainless steel, these companies are now producing baby blue ovens, green vent hoods, pink standing mixers, teal grills, and more. Some of these companies have produced specific color lines while others are going above and beyond, offering the ability to match any color swatch or metal treatment you wish.
On top of these pops of color, according to BHG.com, consumer research indicated a 150 percent increase in interest in shades of metallic, including brass and copper, and a 364 percent increase in interest in gold cabinetry.
However, a brand new appliance may be outside your budget, especially if you are a new homeowner. Not to worry! There is always the infallible accent wall, counter base, or pantry door. This cost-effective, do-it-yourself option is an easy way to refresh the look of your kitchen. You can also consider bringing in bright-colored stools or chairs or introducing bold tiles into your backsplash.
July 2019 Market Statistics
The market statistics are for Maricopa and Pinal Counties. Please let me know if you’d like similar statistics for a specific city or neighborhood within the Phoenix Metro area.
Contact me today at 602-527-1922 to schedule a free consultation.
To view earlier versions of the newsletter, please use the button below.
Real Estate Market Report – June 2019
Real estate market report for the greater Phoenix, AZ metro area.
Or, if you prefer to search by City or <Zip Code>, please select one of those options
National Real Estate Statistics
The National Association of Realtors® reported that existing home sales increased for the first time in two months to 5.34 million in sales, and the median single-family home list price in May 2019 increased as well, to $277,700, up from May 2018 which was $265,100. Nationwide the total inventory at the end of May grew slightly to 4.3 months of supply.
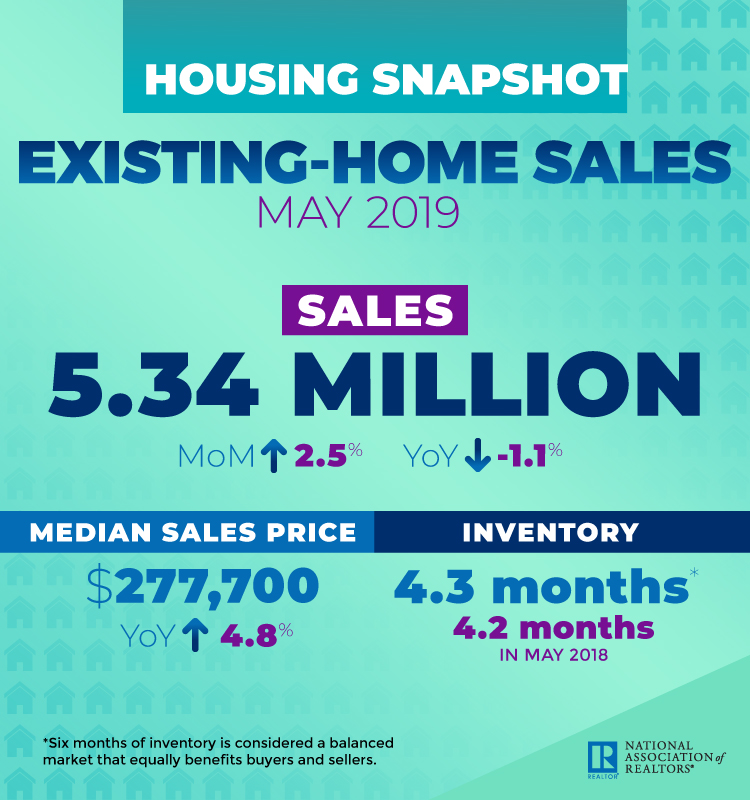
Properties remained on the market for an average of 26 days nationally in May 2019, which was slightly higher than April’s average of 24, and equal to May 2018.
“ More new homes need to be built,” said Lawrence Yun, NAR’s chief economist. “Otherwise, we risk worsening the housing shortage, and an increasing number of middle-class families will be unable to achieve homeownership.”
Maricopa County Statistics
Pinal County Statistics
Phoenix Metro Area Statistics
In the greater Phoenix metro area serviced by the Arizona Regional Multiple Listing System, ARMLS, the May 2019 median list price average set a record high at $278,000, which is significantly higher than the May 2018 median, $265,000. The median sales price is expected to increase in June, then fluctuate slightly throughout the remainder of the year.
Days on market in the greater Phoenix area in May was 65, which is slightly up from May 2018 at 63.
Inventory continues to go down in the Phoenix metro area, with 2.07 month’s supply reported for May 2019. April 2019 was at 2.43 month. Low inventory continues to drive price appreciation in most markets within the Phoenix metro area.
| Month Year | Median Price | Average Price | Active | Under Contract | Sold | Months Supply | DOM |
| May-19 | 278000 | 389200 | 21386 | 12289 | 10341 | 2.07 | 65 |
| Apr-19 | 270000 | 339900 | 23084 | 12536 | 9493 | 2.43 | 69 |
| Mar-19 | 267,000 | 338,000 | 23164 | 11995 | 8344 | 2.78 | 72 |
| Feb-19 | $264,000 | $326,800 | 23271 | 10843 | 6409 | 3.63 | 73 |
| Jan-19 | $262,100 | $326,100 | 22903 | 9247 | 5357 | 4.28 | 72 |
| Dec-18 | $262,000 | $326,000 | 20694 | 6441 | 6403 | 3.23 | 68 |
| Nov-18 | $262,000 | $326,500 | 21477 | 8030 | 6515 | 3.3 | 64 |
| Oct-18 | $262,000 | $324,300 | 21742 | 8307 | 7182 | 3.03 | 61 |
| Sep-18 | $260,000 | $317,500 | 20200 | 8591 | 6897 | 2.93 | 63 |
| Aug-18 | $263,000 | $322,800 | 19822 | 9193 | 8036 | 2.47 | 62 |
| Jul-18 | $265,000 | $320,500 | 19755 | 9135 | 8380 | 2.36 | 60 |
| Jun-18 | $268,000 | $333,600 | 20357 | 10618 | 9079 | 2.24 | 62 |
| May-18 | $265,000 | $331,000 | 20676 | 11630 | 9913 | 2.09 | 63 |
| Apr-18 | $ 254,000 | $ 322,000 | 21772 | 12309 | 8990 | 2.42 | 66 |
| Mar-18 | $254,000 | $316,400 | 21703 | 12319 | 9402 | 2.31 | 72 |
| Feb-18 | $252,500 | $308,000 | 21771 | 12161 | 6911 | 3.18 | 76 |
| Jan-18 | $245,000 | $315,300 | 21664 | 10696 | 6082 | 3.56 | 77 |
Maricopa County Total Inventory vs New Inventory
- 12726,11845,10799,10203,9906,9837,10916,12325,13524,13334,13347,14249
- 6789,6266,6228,5949,5487,6226,6387,6632,5636,4268,7555,7160
Information is deemed to be reliable, but is not guaranteed. © 2024
Maricopa County Absorption Rate
The absorption rate is calculated by dividing the average number of sales per month by the total number of available homes. This shows the rate at which available homes are sold in a specific market during a given time period.
- 2.32,2.23,2.1,2.01,1.96,1.96,2.18,2.5,2.75,2.73,2.74,2.93
Information is deemed to be reliable, but is not guaranteed. © 2024
Have questions or need a market analysis for your current home? Contact us using the form below, or call 480-748-4079.
July 2019 Real Estate Advisor Newsletter
the real estate Advisor
Townhouse vs Condo: Which Should You Buy?
Whether it’s your first time buying or you just want to purchase something smaller, townhouses and condos are both great options. Check out the differences between the two to help aid you in your search!
Condominiums
Condominiums are similar to apartments in that you purchase an individual unit inside of a larger building, but not the property it sits on. This generally includes access to the building’s amenities, such as the clubhouse, pool, and gym. However, condo owners are not responsible for the upkeep and repair of these common areas. Because of the number of shared spaces, living in a condo often allows for meeting new people and building a strong sense of community. There is a fairly similar vetting process for loan approval as for a full-sized home; however, the lender will also look at the health of the condo association.
Townhouses
Those who purchase a townhome are generally purchasing the complete unit, both inside and out, including the land it sits on. This might also include the driveway, yard, or roof. Traditionally, these units are two- or three-stories tall and may also include common areas like pools and parks. Townhome owners pay a fee to a homeowners association every month and the loan process is a same as buying a full-sized home.
Which is the best choice?
Both townhomes and condos offer less maintenance than a traditional home and generally offer great shared areas. Your decision ultimately comes down to your and your family’s needs and wants. Things you’ll want to take into consideration include location, lifestyle, family growth, and price.
Take 5: Prep Your Budget for Buying a Home
Choosing to enter the home buying process is likely the largest financial decision you will make in your lifetime, so it is not one that should be taken lightly. Ensuring that your other current and upcoming financial responsibilities are under control is crucial to having a smooth transaction and being able to enjoy your investment fully. These tips will help you prepare your budget for purchasing your dream home.
Calculate your monthly income. How much money is coming in every month? This is the amount that is left after taxes, health insurance, and retirement savings are taken out of your monthly salary.
Understand your current expenses. Make a list of all your current recurring expenses month to month. Don’t forget to factor in things like loan payments, gym memberships, car maintenance, groceries, self-care appointments, etc.
Determine where you can find savings. Are there any ongoing memberships or subscriptions you don’t use that can be canceled? Can you cut out your daily coffee or eating out a lunch? Make these adjustments right away to start saving more.
Boost your financial standing. Before buying a home, it is recommended that you dedicate extra effort to paying off other debts and boosting your credit score. Taking these steps will help you during the loan approval process.
Don’t move finances around. Your lender will review your bank statements during the pre-approval process and then again during underwriting. Any large withdrawals or deposits may throw a red flag so try to avoid these when possible. If you can’t, make sure you have proper documentation to explain the movement of money.
Top Tips for Decorating with Area Rugs
Looking for a fun way to bring an additional pop of color or design to a room with minimal time or money investment? Consider trying out an amazing area rug! Check out these tips for revamping your space with this fun decor piece.
Consider your lifestyle. Do you have two dogs and a cat? A couple of young kiddos running around? You’ll want to take these factors into consideration. Choose a dark color tone to help hid inevitable stains and make sure the material you choose is easy to clean.
Choose the right size. Expert interior designers recommend choosing a rug that is just slightly smaller than the area covered by furniture, leaving enough space between it and the walls for the flooring to still shine through.
Try these trends. Big bold patterns and rich colors are trending in the interior design space right now and rugs are no different. Try using one as the focal point of the room and select neutral-colored furniture to complement it. Build around the rug. Find a rug that makes a big statement and then build the room around it. Select furniture placement, accent pieces, and colors based on what ties into it. Define the area.
Looking for a way to create two different areas within a single room? Rugs can help you achieve this by defining where one area begins and other starts, such as a reading nook and dining area. Layer multiple. This daring new trend has just popped up on the interior design circuit. Choose two rugs of different shapes and textures and layer them to create depth and a unique focal point.
June 2019 Maricopa County Market Statistics
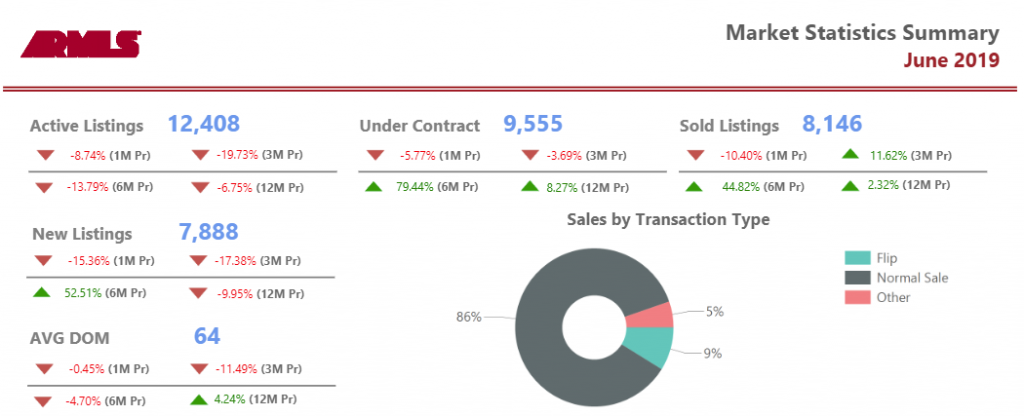
The market statistics are for Maricopa and Pinal Counties. Please let me know if you’d like similar statistics for a specific city or neighborhood within the Phoenix Metro area.
Contact me today at 602-527-1922 to schedule a free consultation.
June 2019 Real Estate Advisor Newsletter
the real estate Advisor
Why You Should Invest in a Rental Property

Investing in real estate can be a great alternative to traditional investments and many owners choose to rent out their property. Here are some of the top benefits for getting into this line of business!
Increase over time. Money being put towards real estate investments has increased substantially over the past few years. This is due to an influx in demand of rental properties and an increase in rental rates. These continue to trend upwards, meaning your property’s value will continue to increase as well.
Security. Unlike investing in stocks, your investment growth is a lot steadier with a very minimal chance that you can lose it all overnight. Generally, experts can predict when the market will start to dip in advance, and you can adjust accordingly.
Create passive income. Investing in a rental property (or four!) can make you money while you sleep and the rent you collect can cover or exceed your mortgage payment and other expenses, allowing you to bring in extra cash flow.
Tax breaks. As a real estate investor, you can take advantage of several tax exemptions. Rental income is not subject to self-employment tax and the government provides tax breaks on insurance, repairs, legal fees, and property taxes.
Inflation. Although normally a bad thing, people who own rental properties actually benefit from inflation because, as the cost of living increases, so does your income.
Flexibility to sell. Renting out a home allows the homeowner the opportunity to be selective about when and if they sell while the home is still appreciating. Once the market is in the right place and the lease is up, they can pull the trigger.
Take 5: What to Pack in a Natural Disaster
In the event of a natural disaster, you have to be ready to flee at a moment’s notice, leaving you very little time to decide what to take. To help you prepare for an evacuation situation from a wildfire, tornado, hurricane, and more, here are 5 things to consider packing.
Special Mementos. Is there a locket handed down from generation to generation that you keep in your jewelry box? Or a sweet note from a loved one tucked away in the closet? Although you can’t take every special keepsake with you, make sure you grab the ones closest to your heart.
Important Documents. Bring identification documents for each member of your family, such as passports, birth certificates, social security cards, etc. You should also pack a copy of health insurance for each person.
Cash. Although it is rare for most people to carry cash on them these days, in the event of a natural disaster it is necessary. In most cases, there is likely to be a power outage in the area, rendering ATM machines and most registers unusable.
First Aid Kit and Medications. Create a first aid kit consisting of band-aids, pain killers, gauze, cleansing towelettes, and gloves. Also, don’t forget to grab any medication your family members are required to take and the prescription script if available in case you need refills.
* Food and Water * Pack non-perishable food items like granola bars, nuts, and dried fruit. Make sure to stock enough water for everyone in your family to at least have 1 gallon a day.
Wallpaper: Don’t Call It a Comeback!
Guess who’s back, back again? Wallpaper has risen to the top of homeowners’ favorite ways to spice up a room again and its easy to see why.
Options. With a variety of colors, patterns, and styles on the market, it’s nearly impossible for you to not find one that matches exactly what you’re looking for. The texture and finish options are endless as well, ranging from silk to leather to suede to mother of pearl. Some of the wallpaper trends we are loving right now include watercolor-inspired designs that transform any room into an artistic haven and nature-forward designs that help bring the outdoors in.
Ease of Use. One of the biggest benefits of wallpaper is it is a fantastic DIY project for you and your spouse, family, or friend. Not only does it go on easily, but it is simple to remove and replace when you are ready to revamp the look of the room. Additionally, this is a great option if you’re a renting a home or apartment. Generally, landlords prefer you do not paint during your rental period, so this easy-to-remove option is a great alternative.
Value. Most wallpaper costs on average $3 to $8 per square foot, depending on the brand and the material. Although the upfront cost of wallpapering a room can be a little more than the cost to paint, the value it offers is substantial. Wallpaper can last anywhere from 15 to 25 years, making it an incredibly cost-effective décor solution in the long run, while a painted wall requires more upkeep and touch-ups and generally you will need to repaint every 5 to 10 years or so.
May 2019 Maricopa County Market Statistics
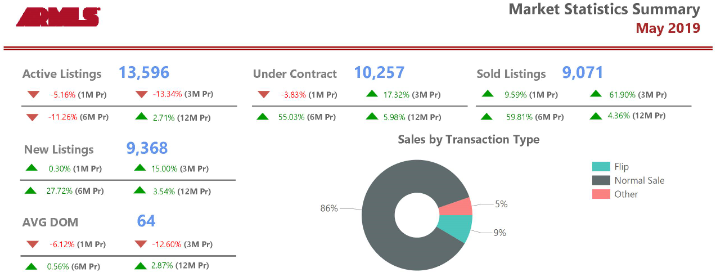
Market statistics are for Maricopa County. If you’d like similar statistics for a specific city or neighborhood, just let me know.
Contact me today to schedule a free consultation.
- « Previous Page
- 1
- …
- 5
- 6
- 7
- 8
- 9
- Next Page »
