Real estate market report for the greater Phoenix, AZ metro area.
Or, if you prefer to search by City or <Zip Code>, please select one of those options
National Real Estate Statistics
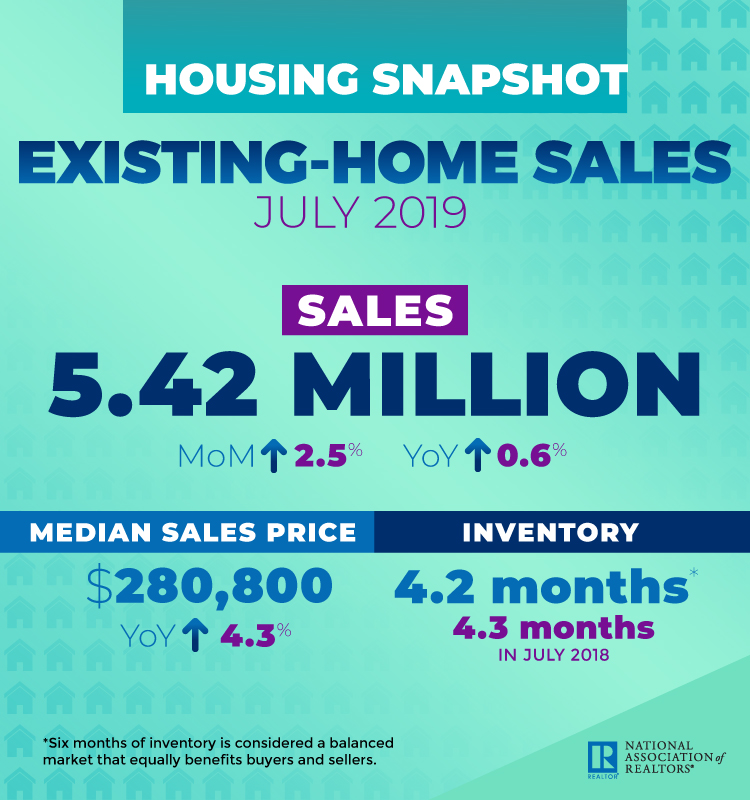
The National Association of Realtors® reported that existing home sales receded 2.2% in September 2019 following two months of increases to 5.38 million in sales. Despite the small decline, overall sales are up 3.9% from a year ago. The median single-family home list price in September 2019 was $272,100, up 5.9% from September 2018 which was $256,900. Nationwide the total unsold inventory at the end of September increased slightly to 4.1 months of supply (4.0 in August, and 4.4 in September 2018). National average days on market increased to 32 days, from 31 days in August, and the same as September 2018. The percentage of total sales for first-time homebuyers increased slightly to 33%, and the percentage of individual investor purchases, which are typically all-cash sales, increased to 14% in Septemeber 2019. Distressed (foreclosure or short sale) sales percentage remains at 2%.
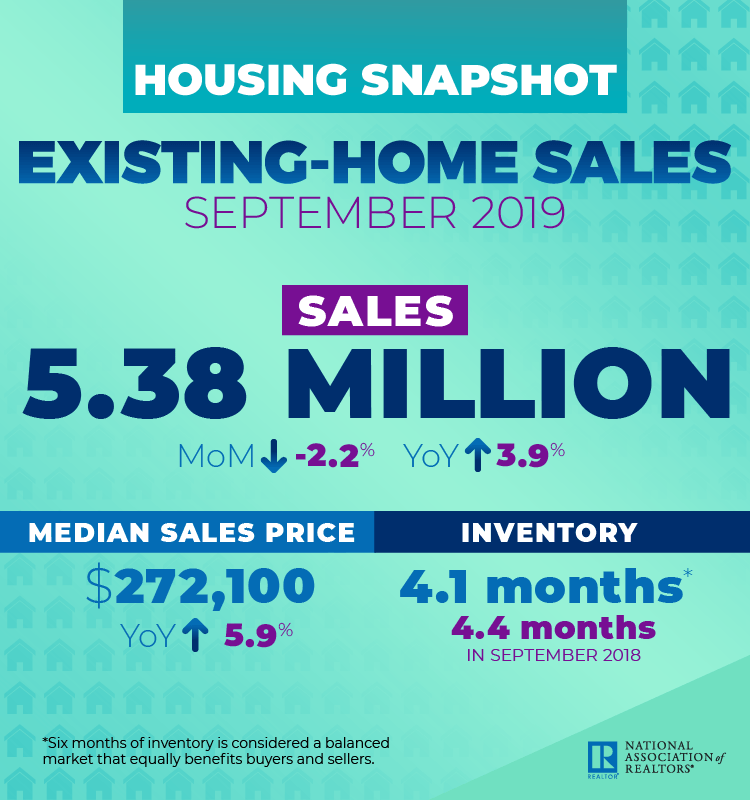
Lawrence Yun, NAR’s chief economist, said that despite historically low mortgage rates, sales have not commensurately increased, in part due to a low level of new housing options. “We must continue to beat the drum for more inventory,” said Yun, who has called for additional home construction for over a year. “Home prices are rising too rapidly because of the housing shortage, and this lack of inventory is preventing home sales growth potential.”
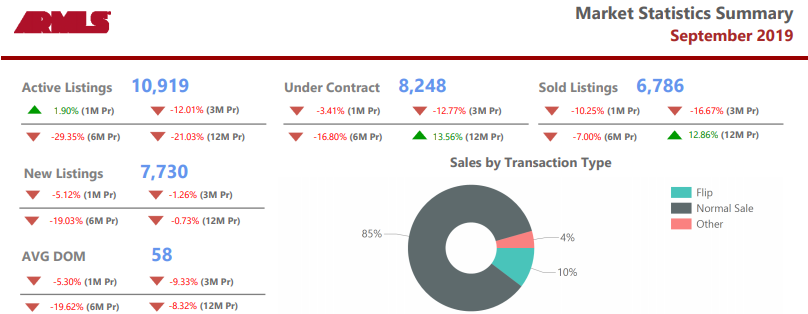
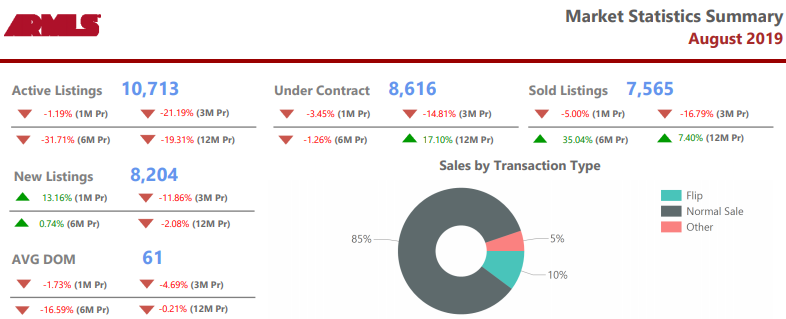
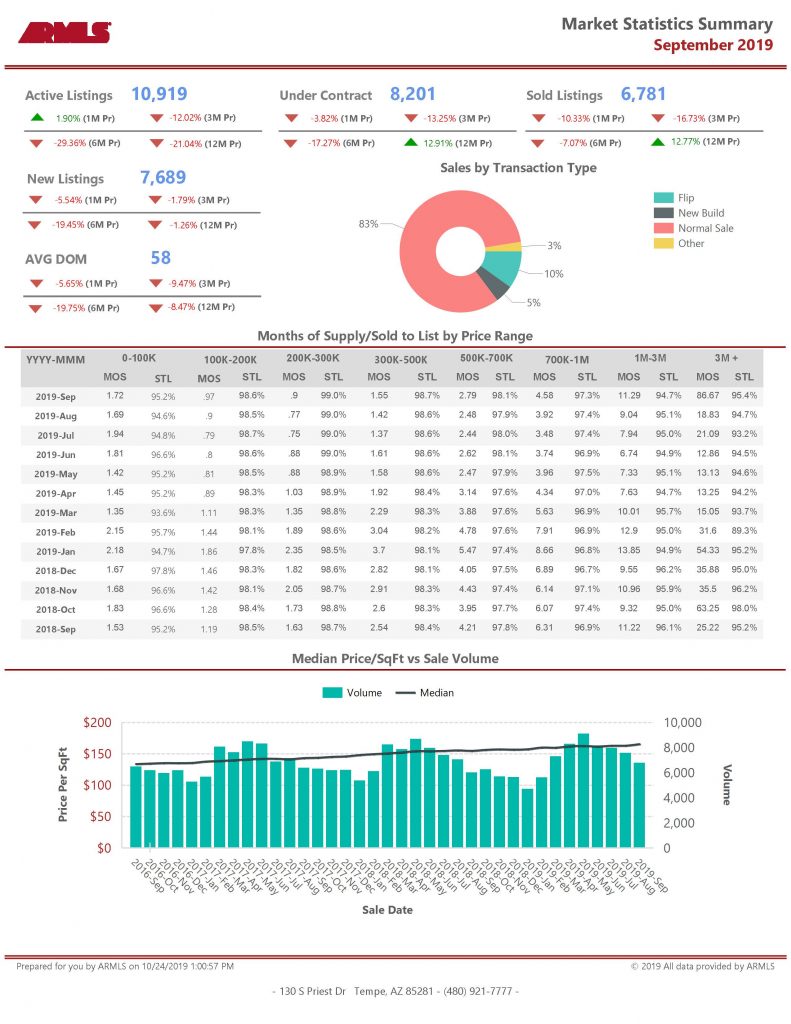
September 2019 Maricopa County Statistics
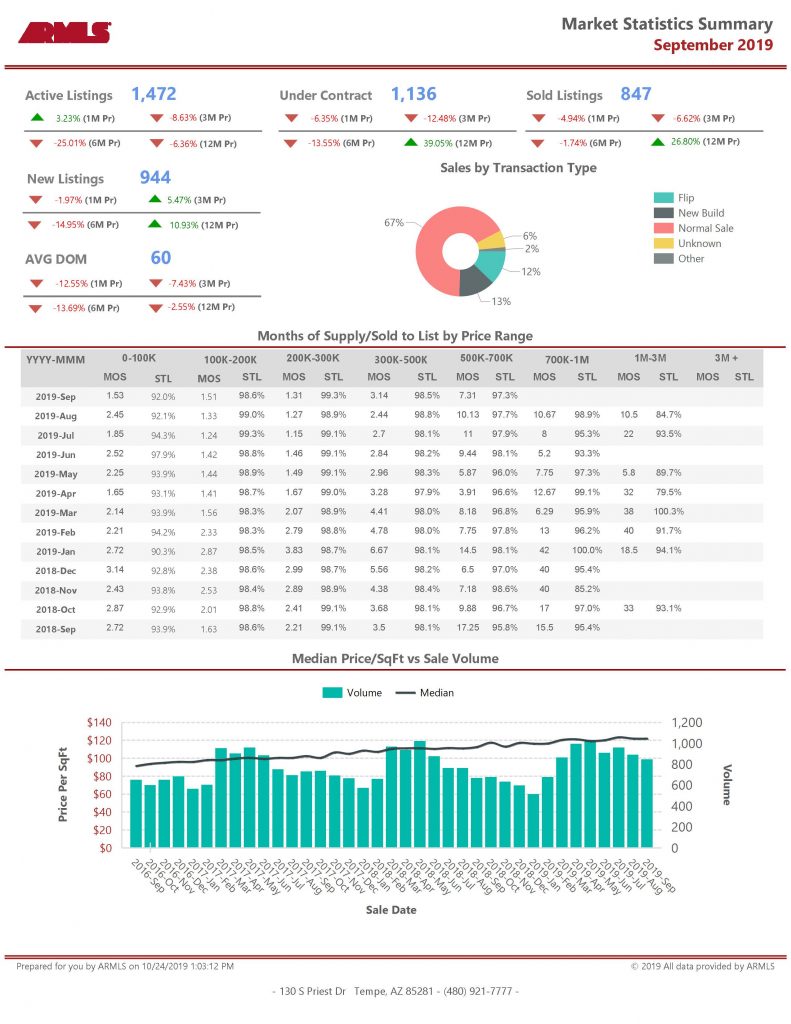
September 2019 Pinal County Statistics
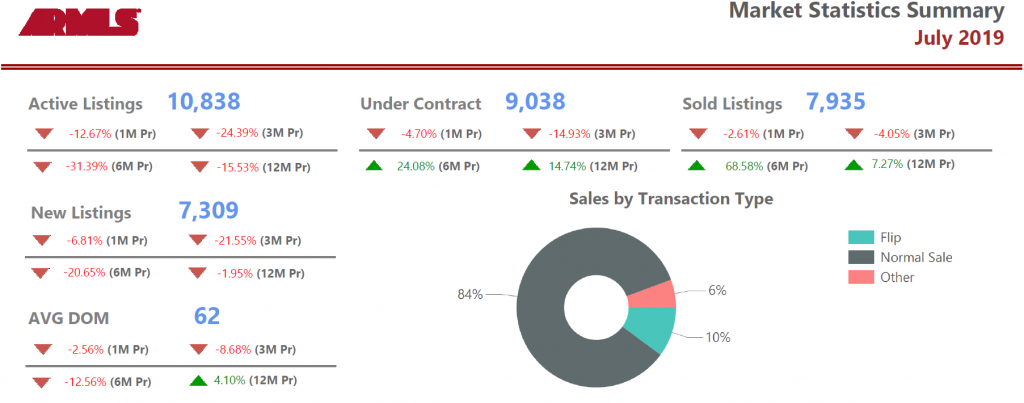
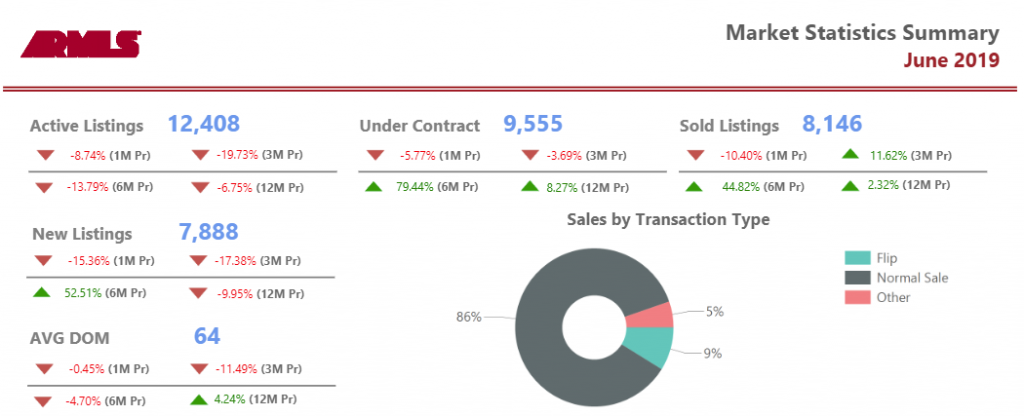
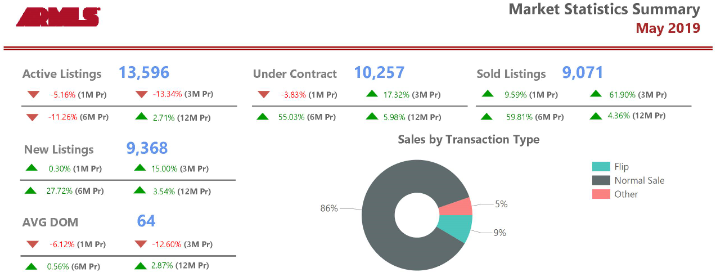
Phoenix Metro Area Statistics
In the greater Phoenix metro area serviced by the Arizona Regional Multiple Listing System, ARMLS, the September 2019 median list price average was $280,000. The median sales price is expected to increase in October.
Days on market in the greater Phoenix area in September 2019 went down to 59, which is lower than September 2018 at 63.
Inventory in the Phoenix metro area is following the season trend increasing slightly from 2.0 in August 2019 to 2.27 in September 2019. Low inventory continues to drive price appreciation in most markets within the Phoenix metro area.
| Month Year | Median Price | Average Price | Active | Under Contract | Sold | Months Supply | DOM |
| Sept-19 | 280000 | 333700 | 13936 | 9694 | 7850 | 2.27 | 59 |
| Aug-19 | 280000 | 338700 | 13350 | 10493 | 8726 | 2.0 | 63 |
| July-19 | 280000 | 341600 | 18007 | 10855 | 9192 | 1.96 | 63 |
| June-19 | 279900 | 350600 | 19778 | 10972 | 9313 | 2.12 | 65 |
| May-19 | 278000 | 389200 | 21386 | 12289 | 10341 | 2.07 | 65 |
| Apr-19 | 270000 | 339900 | 23084 | 12536 | 9493 | 2.43 | 69 |
| Mar-19 | 267,000 | 338,000 | 23164 | 11995 | 8344 | 2.78 | 72 |
| Feb-19 | $264,000 | $326,800 | 23271 | 10843 | 6409 | 3.63 | 73 |
| Jan-19 | $262,100 | $326,100 | 22903 | 9247 | 5357 | 4.28 | 72 |
| Dec-18 | $262,000 | $326,000 | 20694 | 6441 | 6403 | 3.23 | 68 |
| Nov-18 | $262,000 | $326,500 | 21477 | 8030 | 6515 | 3.3 | 64 |
| Oct-18 | $262,000 | $324,300 | 21742 | 8307 | 7182 | 3.03 | 61 |
| Sep-18 | $260,000 | $317,500 | 20200 | 8591 | 6897 | 2.93 | 63 |
| Aug-18 | $263,000 | $322,800 | 19822 | 9193 | 8036 | 2.47 | 62 |
| Jul-18 | $265,000 | $320,500 | 19755 | 9135 | 8380 | 2.36 | 60 |
| Jun-18 | $268,000 | $333,600 | 20357 | 10618 | 9079 | 2.24 | 62 |
| May-18 | $265,000 | $331,000 | 20676 | 11630 | 9913 | 2.09 | 63 |
| Apr-18 | $ 254,000 | $ 322,000 | 21772 | 12309 | 8990 | 2.42 | 66 |
| Mar-18 | $254,000 | $316,400 | 21703 | 12319 | 9402 | 2.31 | 72 |
| Feb-18 | $252,500 | $308,000 | 21771 | 12161 | 6911 | 3.18 | 76 |
| Jan-18 | $245,000 | $315,300 | 21664 | 10696 | 6082 | 3.56 | 77 |
Maricopa County Total Inventory vs New Inventory
- 12726,11845,10799,10203,9906,9837,10916,12325,13524,13334,13347,14249
- 6789,6266,6228,5949,5487,6226,6387,6632,5636,4268,7555,7160
Information is deemed to be reliable, but is not guaranteed. © 2024
Maricopa County Absorption Rate
The absorption rate is calculated by dividing the average number of sales per month by the total number of available homes. This shows the rate at which available homes are sold in a specific market during a given time period.
- 2.32,2.23,2.1,2.01,1.96,1.96,2.18,2.5,2.75,2.73,2.74,2.93
Information is deemed to be reliable, but is not guaranteed. © 2024
Have questions or need a market analysis for your current home? Contact us using the form below, or call 480-748-4079.